Dagstuhl Seminar 21401
Visualization of Biological Data – From Analysis to Communication
( Oct 03 – Oct 08, 2021 )
(Click in the middle of the image to enlarge)
Permalink
Please use the following short url to reference this page:
https://www.dagstuhl.de/21401
Organizers
- Karsten Klein (Universität Konstanz, DE)
- Georgeta Elisabeta Marai (University of Illinois - Chicago, US)
- Kay Katja Nieselt (Universität Tübingen, DE)
- Blaz Zupan (University of Ljubljana, SI)
Contact
- Andreas Dolzmann (for scientific matters)
- Jutka Gasiorowski (for administrative matters)
Impacts
- The Importance of Weakly Co-Evolving Residue Networks in Proteins is Revealed by Visual Analytics : article - Mohan, Sidharth; Ozer, Hatice Gulcin; Ray, William C. - Lausanne : Frontiers Media, 2022. - (Frontiers in Bioinformatics ; 2. 2022, Article no. 836526).
- 2D, 2.5D, or 3D? An Exploratory Study on Multilayer Network Visualisations in Virtual Reality : article in IEEE Transactions on Visualization and Computer Graphics 2023 - Feyer, Stefan P.; Pinaud, Bruno; Kobourov, Stephen G.; Brich, Nicolas; Krone, Michael; Klein, Karsten; Schreiber, Falk; Behrisch, Michael; Kerren, Andreas - Los Alamitos : IEEE, 2023. - 11 pp..
Schedule
The rapidly expanding data generated by advanced methods in biology is creating enormous challenges at the interface between humans and biological data that can be represented and analyzed visually. To meet these challenges, a blend of methodology from the visualization, bioinformatics, and biology domains is required. In this Dagstuhl Seminar we aim to bring together researchers from the multiple domains to discuss how to continue the biovis interdisciplinary dialogue, to foster the development of an international community, to discuss the state-of-the-art and advance areas of research that might benefit from joint efforts of all groups involved. The seminar will be structured around 4 main topics of interest to both the bioinformatics and visualization communities, including teaching biology visualization.
Topic 1: Data abstraction to support building custom visual tools of biological data
In biology, there are precise semantic relationships between data entities. Can we give domain experts the possibility to build custom visualization dashboards via data abstraction? We will make an inventory of data types in various subfields of biological research, and describe their properties and semantic relationships (e.g., a "chromosome" is a coordinate system). These properties and relationships could be described following the standards provided by existing knowledge organization systems.
Topic 2: Interactive analysis for biological data exploration
Exploratory data analysis requires interactive visualizations and construction of workflows that combine visual displays with components for data management, preprocessing, modeling, and statistical analysis. There are many toolboxes available that support such analysis, but there is little consensus on their systematic design to support biologists in data integration, replication of results, storytelling, and big data analysis. How do we best combine interactive visualization with other tasks such as data normalization, machine learning, embedding, and network inference?
Topic 3: Collaboration and communication through new tools
We will investigate how established visualizations can be combined in a consistent manner that is intuitively understandable by domain experts, and how insights can be communicated at different levels of granularity. Further research questions are, how the dynamics of the underlying processes can be visualized in such a setting, how comparison between different conditions, organisms, or groups can be efficiently supported, and, given the experimental nature of data in biology, how different levels of data uncertainty and inconsistency can be intuitively represented.
Topic 4: A curriculum for teaching visualization in bioinformatics
Despite the increasing importance of visualization for bioinformatics, there is currently a general lack of integration into the bioinformatics education, and a useful and appropriate curriculum has not yet been developed. In this topic the following questions will be addressed: What should a modern and seminal curriculum for visualization in bioinformatics look like? What are the essential topics, and how can comprehensive training be achieved?
 Creative Commons BY 3.0 DE
 Karsten Klein, Georgeta Elisabeta Marai, Kay Katja Nieselt, and Blaz Zupan
Advances in technology have turned biology into data-driven research. High-throughput and high-resolution techniques help us generate and collect vast amounts of data to be explored, analyzed, and turned into knowledge or actionable models. This abundance of biological data creates a substantial challenge in processing, analysis, and modeling. A popular way to address this challenge is through visual representation and analysis of the data. Creating compelling visualizations of biological data requires combining data visualization, bioinformatics, statistics, and computational biology. The field of biological visualization is interdisciplinary and involves collaboration between researchers from different areas.
Our aim with this Dagstuhl Seminar was to bring together researchers from multiple disciplines to discuss how to continue the interdisciplinary dialogue and foster the development of an international community concerned with biological visualization. We aimed to examine the state of the art and find areas to advance the research that might benefit from the joint efforts of all groups involved.
Our initial aim, expressed in the seminar proposal, was to explore the following four topics:
- data abstraction to support building custom visual tools of biological data,
- interactive analysis for biological data exploration,
- collaboration and communication through new tools,
- curriculum for teaching visualization in bioinformatics.
We have discussed these topics in the first two days of our five-day seminar and gradually came out with the following six working groups:
- facilitating cross-expertise exploration in explainable AI for multi-omics via visualization,
- visions for the lab notebook of the future,
- visual analytics of multilayer networks representing knowledge graphs,
- recommendations for designing visual, interpretable, and deep learning-based analytics pipelines in medical imaging,
- semantically enabled biomedical cartooming,
- a curriculum for the future of biological visualization.
Notice that with this new set of topics for the working groups, our seminar still closely followed our initial aim to explore the space of data abstractions, interactive analysis, and design of tools to support collaborations.
We have developed the schedule for the seminar based on our experience and expertise in previous successful Dagstuhl seminars. We aim to emphasize the balance between prepared talks and panels and breakout groups for less structured discussions focused on a selection of highly relevant topics. Three types of plenary presentations were available to participants who had indicated an interest in presenting during the seminar:
- Overview talks (20 minutes plus 10 minutes for questions)
- Regular talks (10 minutes plus 5 minutes for questions)
- Panel presentations (5 minutes per speaker followed by a 20 -- 25 minute discussion)
The breakout groups met multiple times for several hours during the week and reported to the overall group on several occasions. This format successfully brought bioinformatics and visualization researchers onto the same platform and enabled researchers to reach a shared, deep understanding through their questions and answers. It also stimulated fruitful discussions that all participants deeply appreciated.
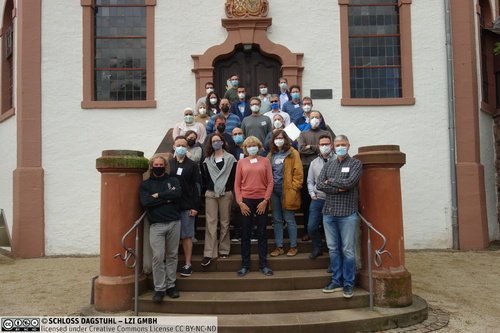
We have organized the seminar during the COVID-19 pandemic. Due to various regulations and quarantines, slightly above half of the participants attended in person, while the other participants attended online. The meeting took the hybrid form, and we thank Dagstuhl for equipping the seminar rooms with suitable hardware. Still, we found the organization of the hybrid meeting challenging, to say the least, as it imposed constraints on the discussion and engagement of everyone. An all-important part of Dagstuhl's experience is off-line meetings during meals, trips, or long evenings, which online participants miss. Thus, also following the responses in the participants' survey, we would endorse their recommendation that Dagstuhl should return to the previous, non-hybrid format of seminars once the pandemic stops.
This report describes in detail the outcomes of our meeting. At the present stage, the outcome includes a set of white papers summarizing the breakout sessions, overviews of the talks, and an emerging detailed curriculum for future biological and medical visualization eduction.
Acknowledgements
We would like to thank all participants of the seminar for their contributions and lively discussions; we also would like to thank the scientific directorate of Dagstuhl for providing us with the opportunity to organize this seminar. Finally, the seminar would not have been possible without the untiring help of the (scientific) staff of Dagstuhl, including Ms. Jutka Gasiorowski and Ms. Susanne Bach-Bernhard.
Kay Katja Nieselt, Karsten Klein, Georgeta Elisabeta Marai, and Blaz Zupan
On-site
- Jan Aerts (Hasselt University - Diepenbeek, BE) [dblp]
- Emma Beauxis-Aussalet (VU University Amsterdam, NL) [dblp]
- Michael Behrisch (Utrecht University, NL) [dblp]
- Katja Bühler (VRVis - Wien, AT) [dblp]
- Nadezhda T. Doncheva (University of Copenhagen, DK) [dblp]
- Mennatallah El-Assady (ETH Zürich, CH) [dblp]
- Carsten Görg (University of Colorado - Aurora, US) [dblp]
- Theresa Anisja Harbig (Universität Tübingen, DE) [dblp]
- Lynda Hardman (CWI - Amsterdam, NL & Utrecht University, NL) [dblp]
- Lawrence Hunter (University of Colorado - Aurora, US) [dblp]
- Helena Jambor (Universitätsklinikum TU Dresden, DE) [dblp]
- Andreas Kerren (Linköping University, SE) [dblp]
- Karsten Klein (Universität Konstanz, DE) [dblp]
- Stephen Kobourov (University of Arizona - Tucson, US) [dblp]
- Alexander Koch (BioLizard - Gent, BE) [dblp]
- Michael Krone (Universität Tübingen, DE) [dblp]
- Martin Krzywinski (BC Cancer Research Centre - Vancouver, CA) [dblp]
- Alexander Lex (University of Utah - Salt Lake City, US) [dblp]
- Lennart Martens (Ghent University, BE) [dblp]
- Torsten Möller (Universität Wien, AT) [dblp]
- Kay Katja Nieselt (Universität Tübingen, DE) [dblp]
- Bruno Pinaud (University of Bordeaux, FR) [dblp]
- Timo Ropinski (Universität Ulm, DE) [dblp]
- Falk Schreiber (Universität Konstanz, DE) [dblp]
- Cagatay Turkay (University of Warwick - Coventry, GB) [dblp]
- Blaz Zupan (University of Ljubljana, SI) [dblp]
Remote:
- Jillian Aurisano (University of Cincinnati, US) [dblp]
- Tanya Berger-Wolf (Ohio State University - Columbus, US) [dblp]
- Katy Börner (Indiana University - Bloomington, US) [dblp]
- Andreas Bueckle (Indiana University - Bloomington, US) [dblp]
- Guadalupe Canahuate (University of Iowa, US) [dblp]
- Jian Chen (Ohio State University - Columbus, US) [dblp]
- Nils Gehlenborg (Harvard University - Boston, US) [dblp]
- Barbora Kozlíková (Masaryk University - Brno, CZ) [dblp]
- Raghu Machiraju (Ohio State University - Columbus, US) [dblp]
- Georgeta Elisabeta Marai (University of Illinois - Chicago, US) [dblp]
- James Procter (University of Dundee, GB) [dblp]
- William Ray (Ohio State University - Columbus, US) [dblp]
- Jos B.T.M. Roerdink (University of Groningen, NL) [dblp]
- Ryo Sakai (GSK - Uxbridge, GB) [dblp]
- Hagit Shatkay (University of Delaware - Newark, US) [dblp]
- Charlotte Soneson (FMI - Basel, CH) [dblp]
- Miha Stajdohar (Genialis - Houston, US) [dblp]
- Marc Streit (Johannes Kepler Universität Linz, AT) [dblp]
- Granger Sutton (J. Craig Venter Institute - Rockville, US) [dblp]
- Danielle Szafir (University of North Carolina at Chapel Hill, US) [dblp]
- Mathias Witte Paz (Universität Tübingen, DE)
Related Seminars
- Dagstuhl Seminar 12372: Biological Data Visualization (2012-09-09 - 2012-09-14) (Details)
- Dagstuhl Seminar 18161: Visualization of Biological Data - Crossroads (2018-04-15 - 2018-04-20) (Details)
- Dagstuhl Seminar 23451: Visualization of Biomedical Data - Shaping the Future and Building Bridges (2023-11-05 - 2023-11-10) (Details)
- Dagstuhl Seminar 26101: Contextualising Complexity - Faithful Visualisations for Biology (2026-03-01 - 2026-03-06) (Details)
Classification
- bioinformatics
- computer graphics / computer vision
- modelling / simulation
Keywords
- Interdisciplinarity
- Informatics
- Biology
- Computational biology
- Visualization