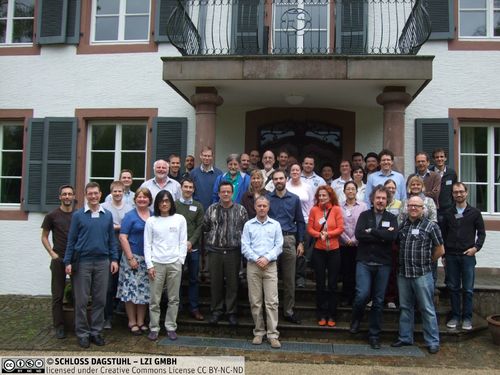
Dagstuhl Seminar 13201
Information Visualization – Towards Multivariate Network Visualization
( May 12 – May 17, 2013 )
(Click in the middle of the image to enlarge)
Permalink
Please use the following short url to reference this page:
https://www.dagstuhl.de/13201
Organizers
- Andreas Kerren (Linnaeus University - Växjö, SE)
- Helen C. Purchase (University of Glasgow, GB)
- Matthew O. Ward (Worcester Polytechnic Institute, US)
Contact
- Andreas Dolzmann (for scientific matters)
- Annette Beyer (for administrative matters)
Press/News
Schedule
The goal of this third Dagstuhl Seminar on Information Visualization is to bring together theoreticians and practitioners from Information Visualization, HCI, and Graph Drawing with a special focus on multivariate network visualization, i.e., on graphs where the nodes and/or edges have additional (multidimensional) attributes. To support discussions related to the visualization of real world data, we will also invite researchers from selected application areas, especially bioinformatics, social sciences, and software engineering.
The integration of multivariate data into complex networks and their visual analysis is one of the big challenges not only in visualization, but also in many application areas. This Dagstuhl seminar will discuss the state-of-the-art, new directions, and open challenges of multivariate network visualization. It will be a unique event that brings domain experts together with visualization experts, providing rare opportunities for collaboration and research synergy. The following themes will be discussed:
- Graph drawing vs. Information visualization
The field of graph drawing has mainly focused on the structure of graphs, whereas practitioners of information visualization are more concerned with embedding information, often multivariate, into the nodes and the links. How can we merge the best practices of both fields? - Focus on biochemistry / bioinformatics
In the life sciences, huge data sets are generated by high-throughput experimental techniques. Consequently, biologists use computational methods to support data analysis. The information in many experimental data sets can be either represented as networks or interpreted in the context of various networks. How can our current techniques help to analyze primary and secondary data in the context of such networks, and how can different network types be combined? - Focus on software engineering
In the application domain of software engineering, various graphs and data attached to graphs (e.g., software metrics) play a dominant role in the static and dynamic analysis of programs. Which of these problems are conceptually similar to graph-related problems in biology and how can multivariate network visualization support specific tasks, such as software architecture recovery? - Focus on social science
Graph drawing techniques have been used for several years for the visualization and analysis of social networks, but other social science fields (e.g., geography, politics, cartography, and economics) also make use of data visualization. How can (or do) our network visualizations support these domains? - Evaluation and experimental design
While visualizations and tools can be valued for their complexity or elegance, the ultimate proof of their worth is in whether they support users’ interpretation and analysis tasks. Which experimental methods best support the evaluation of techniques for visualizing information, and how are such methods best employed? - Approaches and methods
There already exist a number of technical approaches, algorithms, and methods to interactively visualize multivariate networks. Which ones are suitable for solving specific tasks in our applications areas? What is their potential? What are their limitations? By identifying the range of approaches that do exist, can we see the potential for new, innovative visualization ideas? - Toolkits and standards
Rapid development of new tools, as well as efficient comparison of the effectiveness of different tools, is greatly simplified by the use of toolkits and standard data/information representations. What progress has been made to date on achieving these goals? - Challenges for the next ten years
Multivariate networks are large and complex and their complexity will increase in the future. Thus, not all problems can be solved in the short term. What are the current challenges? What challenges can be solved and what challenges do we expect to come up during the next ten years?
The organizers are confident that the in-depth discussions and the presented research will provide a better understanding of the focus topic, and foster interdisciplinary collaboration. We plan to publish the results of this Dagstuhl seminar in a special issue of a high impact visualization journal or in a coherent book in order to ensure that the findings reach a broader audience.
-
Daten - der neue Rohstoff
Saarländischer Rundfunk, SR2-Kulturmagazin Länge 7 am 19.05.2013 Jochen Erdmenger im Gespräch mit Prof. Andreas Kerren -
Netzwerke und komplexe Daten gemeinsam visualisieren
Die Saarbrücker Zeitung berichtet über das Dagstuhl-Seminar am 07.05.2013 - Wie riesige Netzwerke und komplexe Daten gemeinsam visualisiert werden; Press Release (in German)
Information Visualization (InfoVis) is a research area that focuses on the use of visualization techniques to help people understand and analyze data. While related fields such as Scientific Visualization involve the presentation of data that has some physical or geometric correspondence, Information Visualization centers on abstract information without such correspondences, i.e., it is not possible to map this information into the physical world in most cases. Examples of such abstract data are symbolic, tabular, networked, hierarchical, or textual information sources.
The first two Dagstuhl Seminars on Information Visualization aimed to cover more general aspects of our field, such as interaction, evaluation, data wrangling, and collaboration, or focused on higher level topics, for instance, the value of InfoVis or the importance of aesthetics. Besides the Dagstuhl reports that are typically published directly after a seminar [1,2,4,5], there were also follow-up publications for both seminars. The participants of Seminar #07221 wrote book chapters which have been consolidated into a Springer book [7]; the organizers of the same seminar published a workshop report in the Information Visualization journal [6]. For the second Seminar #10241, a special issue in the same journal was published [3].
The goal of this third Dagstuhl Seminar on Information Visualization was to bring together theoreticians and practitioners from Information Visualization, HCI, and Graph Drawing with a special focus on multivariate network visualization, i.e., on graphs where the nodes and/or edges have additional (multidimensional) attributes. The integration of multivariate data into complex networks and their visual analysis is one of the big challenges not only in visualization, but also in many application areas. Thus, in order to support discussions related to the visualization of real world data, we also invited researchers from selected application areas, especially bioinformatics, social sciences, and software engineering. The unique "Dagstuhl climate" ensured an open and undisturbed atmosphere to discuss the state-of-the-art, new directions, and open challenges of multivariate network visualization.
Seminar Topics
The following themes were discussed during the seminar. The seminar allowed attendees to critically reflect on current research efforts, the state of field, and key research challenges today. Participants also were encouraged to demonstrate their system prototypes and tools relevant to the seminar topics. In consequence, topics emerged in the seminar week and were the focus of deeper discussions too.
- Focus on biochemistry/bioinformatics: In the life sciences, huge data sets are generated by high-throughput experimental techniques. Consequently, biologists use computational methods to support data analysis. The information in many experimental data sets can be either represented as networks or interpreted in the context of various networks. How can our current techniques help to analyze primary and secondary data in the context of such networks, and how can different network types be combined?
- Focus on social science: Graph drawing techniques have been used for several years for the visualization and analysis of social networks, but other social science fields (e.g., geography, politics, cartography, and economics) also make use of data visualization. How can (or do) our network visualizations support these domains?
- Focus on software engineering: In the application domain of software engineering, various graphs and data attached to graphs (e.g., software metrics) play a dominant role in the static and dynamic analysis of programs. Which of these problems are conceptually similar to graph-related problems in biology or social sciences and how can multivariate network visualization support specific tasks, such as software architecture recovery?
- Approaches and methods: There already exist a number of technical approaches, algorithms, and methods to interactively visualize multivariate networks. Which ones are suitable for solving specific tasks in our applications areas? What is their potential? What are their limitations? By identifying the range of approaches that do exist, can we see the potential for new, innovative visualization ideas?
- Challenges in visualizing multivariate networks: Multivariate networks are large and complex and their complexity will increase in the future. Thus, not all problems can be solved in the short term. What are the current challenges?
- Time-dependent/dynamic networks: Many networks that are considered in practice change over time with respect to their topology and/or their attributes. How can we best visualize networks and attributes that change over time?
- Interaction: How can we best support the navigation, exploration and modification of multivariate networks?
- Multiple networks at different scales: How can we integrate, combine, compare more than one multivariate network at different scales? In this context, the term of so-called multi-modal networks is often used in literature. What does this term mean exactly? Can we visualize a range of different information types concurrently?
- Tasks: What range of tasks can multivariate network visualization support? Are there general tasks for all application domains?
- Novel metaphors: What type of visualization metaphors should we use beyond node-link diagrams? What would be the benefit in doing so?
Outcomes
The organizers and participants decided to write a book on multivariate network visualization to be published as LNCS issue by Springer. The possibility of publishing this Springer book was confirmed by the Editor-in-Chief of LNCS already before the start of the seminar. Working groups have been invited to submit a book chapter building on their discussions and findings, and writing is underway. The final chapters are to be submitted by November~3, 2013, with a planned publication date of Spring 2014. A preliminary book structure was presented at the end of the seminar:
- Introduction
- Definition of multivariate networks, typical representations
- Domain Application Data Characteristics in Context of Multivariate Networks
- Biology
- Social Sciences
- Software Engineering
- Tasks
- Interaction
- Metaphors (Visual Mappings beyond Node-Link)
- Multiple and Multi-Domain Networks
- Temporal Networks
- Scalability
- Summary/Conclusion
The Dagstuhl team performed an evaluation at the end of the seminar week. The results of this survey (scientific quality, inspiration to new ideas/projects/research/papers, insights from neighboring fields, ... ) were throughout very good to excellent. Only a few single improvements were proposed by participants, for example, more junior researchers should be invited to come into contact with world-class researchers. And more domain experts should be invited to be spread out across the breakout groups. Another issue was that the time available for group work should be extended in future seminars.
References
- Andreas Kerren, Catherine Plaisant, and John T. Stasko. 10241 Abstracts Collection: Information Visualization. In Andreas Kerren, Catherine Plaisant, and John T. Stasko, editors, Information Visualization, number 10241 in Dagstuhl Seminar Proceedings, Dagstuhl, Germany, 2010. Schloss Dagstuhl – Leibniz-Zentrum fuer Informatik, Germany.
- Andreas Kerren, Catherine Plaisant, and John T. Stasko. 10241 Executive Summary: Information Visualization. In Andreas Kerren, Catherine Plaisant, and John T. Stasko, editors, Information Visualization, number 10241 in Dagstuhl Seminar Proceedings, Dagstuhl, Germany, 2010. Schloss Dagstuhl – Leibniz-Zentrum fuer Informatik, Germany.
- Andreas Kerren, Catherine Plaisant, and John T. Stasko. Information Visualization: State of the Field and New Research Directions. Information Visualization, 10(4):269–270, 2011.
- Andreas Kerren, John T. Stasko, Jean-Daniel Fekete, and Chris North. 07221 Abstracts Collection: Information Visualization – Human-Centered Issues in Visual Representation, Interaction, and Evaluation. In Jean-Daniel Fekete, Andreas Kerren, Chris North, and John T. Stasko, editors, Information Visualization – Human-Centered Issues in Visual Representation, Interaction, and Evaluation, number 07221 in Dagstuhl Seminar Proceedings, Dagstuhl, Germany, 2007. Internationales Begegnungs- und Forschungszentrum für Informatik (IBFI), Schloss Dagstuhl, Germany.
- Andreas Kerren, John T. Stasko, Jean-Daniel Fekete, and Chris North. 07221 Executive Summary: Information Visualization – Human-Centered Issues in Visual Representation, Interaction, and Evaluation. In Jean-Daniel Fekete, Andreas Kerren, Chris North, and John T. Stasko, editors, Information Visualization – Human-Centered Issues in Visual Representation, Interaction, and Evaluation, number 07221 in Dagstuhl Seminar Proceedings, Dagstuhl, Germany, 2007. Internationales Begegnungs- und Forschungszentrum für Informatik (IBFI), Schloss Dagstuhl, Germany.
- Andreas Kerren, John T. Stasko, Jean-Daniel Fekete, and Chris North. Workshop Report: Information Visualization – Human-Centered Issues in Visual Representation, Interaction, and Evaluation. Information Visualization, 6(3):189–196, 2007.
- Andreas Kerren, John T. Stasko, Jean-Daniel Fekete, and Chris North, editors. Information Visualization: Human-Centered Issues and Perspectives, volume 4950 of Lecture Notes in Computer Science. Springer, Berlin, Heidelberg, 2008.
 Creative Commons BY 3.0 Unported license
 Andreas Kerren, Helen C. Purchase, and Matthew O. Ward
- James Abello (Rutgers University - Piscataway, US) [dblp]
- Daniel Archambault (Swansea University, GB) [dblp]
- Katy Börner (Indiana University - Bloomington, US) [dblp]
- Maura Conway (Dublin City University, IE) [dblp]
- Stephan Diehl (Universität Trier, DE) [dblp]
- Tim Dwyer (Monash University - Caulfield, AU) [dblp]
- Peter Eades (The University of Sydney, AU) [dblp]
- Niklas Elmqvist (Purdue University - West Lafayette, US) [dblp]
- Jean-Daniel Fekete (University of Paris South XI, FR) [dblp]
- Helen Gibson (University of Northumbria, GB) [dblp]
- Carsten Görg (University of Colorado - Aurora, US) [dblp]
- Hans Hagen (TU Kaiserslautern, DE) [dblp]
- Benjamin David Hennig (University of Sheffield, GB) [dblp]
- Danny Holten (SynerScope BV, NL) [dblp]
- Christophe Hurter (ENAC - Toulouse, FR) [dblp]
- T. J. Jankun-Kelly (Mississippi State University, US) [dblp]
- Daniel A. Keim (Universität Konstanz, DE) [dblp]
- Jessie Kennedy (Edinburgh Napier University, GB) [dblp]
- Andreas Kerren (Linnaeus University - Växjö, SE) [dblp]
- Stephen Kobourov (University of Arizona - Tucson, US) [dblp]
- Oliver Kohlbacher (Universität Tübingen, DE) [dblp]
- Robert Kosara (Tableau Software - Seattle, US) [dblp]
- Lothar Krempel (MPI für Gesellschaftsforschung - Köln, DE) [dblp]
- Kwan-Liu Ma (University of California - Davis, US) [dblp]
- Guy Melançon (University of Bordeaux, FR) [dblp]
- Silvia Miksch (TU Wien, AT) [dblp]
- Martin Nöllenburg (KIT - Karlsruher Institut für Technologie, DE) [dblp]
- A. Johannes Pretorius (University of Leeds, GB) [dblp]
- Helen C. Purchase (University of Glasgow, GB) [dblp]
- Jonathan C. Roberts (Bangor University, GB) [dblp]
- Falk Schreiber (IPK Gatersleben & MLU Halle, DE) [dblp]
- John T. Stasko (Georgia Institute of Technology - Atlanta, US) [dblp]
- Alexandru C. Telea (University of Groningen, NL) [dblp]
- Jarke J. van Wijk (TU Eindhoven, NL) [dblp]
- Tatiana von Landesberger (TU Darmstadt, DE) [dblp]
- Matthew O. Ward (Worcester Polytechnic Institute, US) [dblp]
- Michael Wybrow (Monash University - Caulfield, AU) [dblp]
- Kai Xu (Middlesex University - London, GB) [dblp]
- Jing Yang (University of North Carolina - Charlotte, US) [dblp]
- Michelle X. Zhou (IBM Almaden Center, US) [dblp]
- Björn Zimmer (Linnaeus University - Växjö, SE) [dblp]
Related Seminars
Classification
- Visualization
- Computer Graphics / Computer Vision
- Society / HCI
Keywords
- Information Visualization
- Data Visualization
- Visualization
- Graph Drawing
- Visual Network Analysis
- Biology
- Bioinformatics
- Social Sciences
- Software Engineering