Dagstuhl Seminar 25072
What You Hear is What You See? Integrating Sonification and Visualization
( Feb 09 – Feb 14, 2025 )
(Click in the middle of the image to enlarge)
Permalink
Please use the following short url to reference this page:
https://www.dagstuhl.de/25072
Organizers
- Wolfgang Aigner (FH - St. Pölten, AT)
- Sara Lenzi (Universidad de Deusto - Bilbao, ES)
- Niklas Rönnberg (Linköping University, SE)
Contact
- Marsha Kleinbauer (for scientific matters)
- Simone Schilke (for administrative matters)
Schedule
In our daily lives, we as humans perceive our surroundings in an inherently multimodal way. However, the vast majority of data analysis idioms are exclusively visual, not using the apparent potential of combined designs. While the visualization field studies visual data analysis solutions, the sonification field investigates comparable solutions that convey data over non-speech audio. There are several similarities between the methods and design theories of both approaches, such as the use of perceptual variables to encode data attributes, the use of marks and substrates to convey items, and the role of interaction in manipulating the data representations.
Over the last decades, both fields have established research communities, theoretical frameworks, and toolkit support. Although extensive research has been conducted on both auditory and visual representation of data, relatively little is known about their systematic and complementary combination for data exploration, analysis, and presentation. There are potential powerful synergies in combining both modalities to address the individual limitations of each other. Nevertheless, existing research on combinations has often focused only on one of the modalities.
This Dagstuhl Seminar aimed, first and foremost, at creating a space for discussion where the international communities of data visualization and data sonification came together to map and define a novel field for the improvement of human - data relationships. Over five days, 24 experts from both fields participated in group activities, inspirational sessions, keynote presentations, and informal gatherings. The seminar was the result of work conducted in the previous years by the organizers, including research projects, as well as a series of meetups and workshops and meetups of the AVAC - Audio Visual Analytics Community (https://audio-visual-analytics.github.io) at different venues:
- STAR and Panel @ EuroVis 2024 (Odense, Denmark): May 29-30, 2024
- Panel Discussion @ ICAD 2023 (Norrköping, Sweden): June 29, 2023
- Application Spotlight @ IEEE VIS (Oklahoma City, USA/hybrid): October 20, 2022
- 3rd Workshop on Audio-Visual Analytics @ Int. Conf. Advanced Visual Interfaces: June 7, 2022
- Workshop @ IEEE VIS (virtual): October 25, 2021
- Workshop @ Audio Mostly (virtual): September 3, 2021
Moreover, a State of the Art Report on data visualization and data sonification~\cite{enge_star_2024-a} was published as collaborative achievement of members of both communities. Based on these activities, the organizers identified a number of potential topics of discussion and shared them with the participants prior to the seminar. After an iterative, collective process of selection, we identified nine topics to be discussed in groups during the 5-day Dagstuhl Seminar:
- Design theory for joint visualization and sonification
- Design framework for joint visualization and sonification
- Application examples & success stories
- Tools and libraries
- Perception and cognition
- Redundancy and complementarity
- Interaction
- Accessibility
- Evaluation of joint visualization and sonification
During the seminar, after two inspirational keynote presentations that introduced the main achievements, techniques, tools, and challenges of both fields, participants were assigned to two topics of their choice, which they engaged in deeply in small discussion groups over the course of the week. Figure 1 shows the full schedule of the seminar.
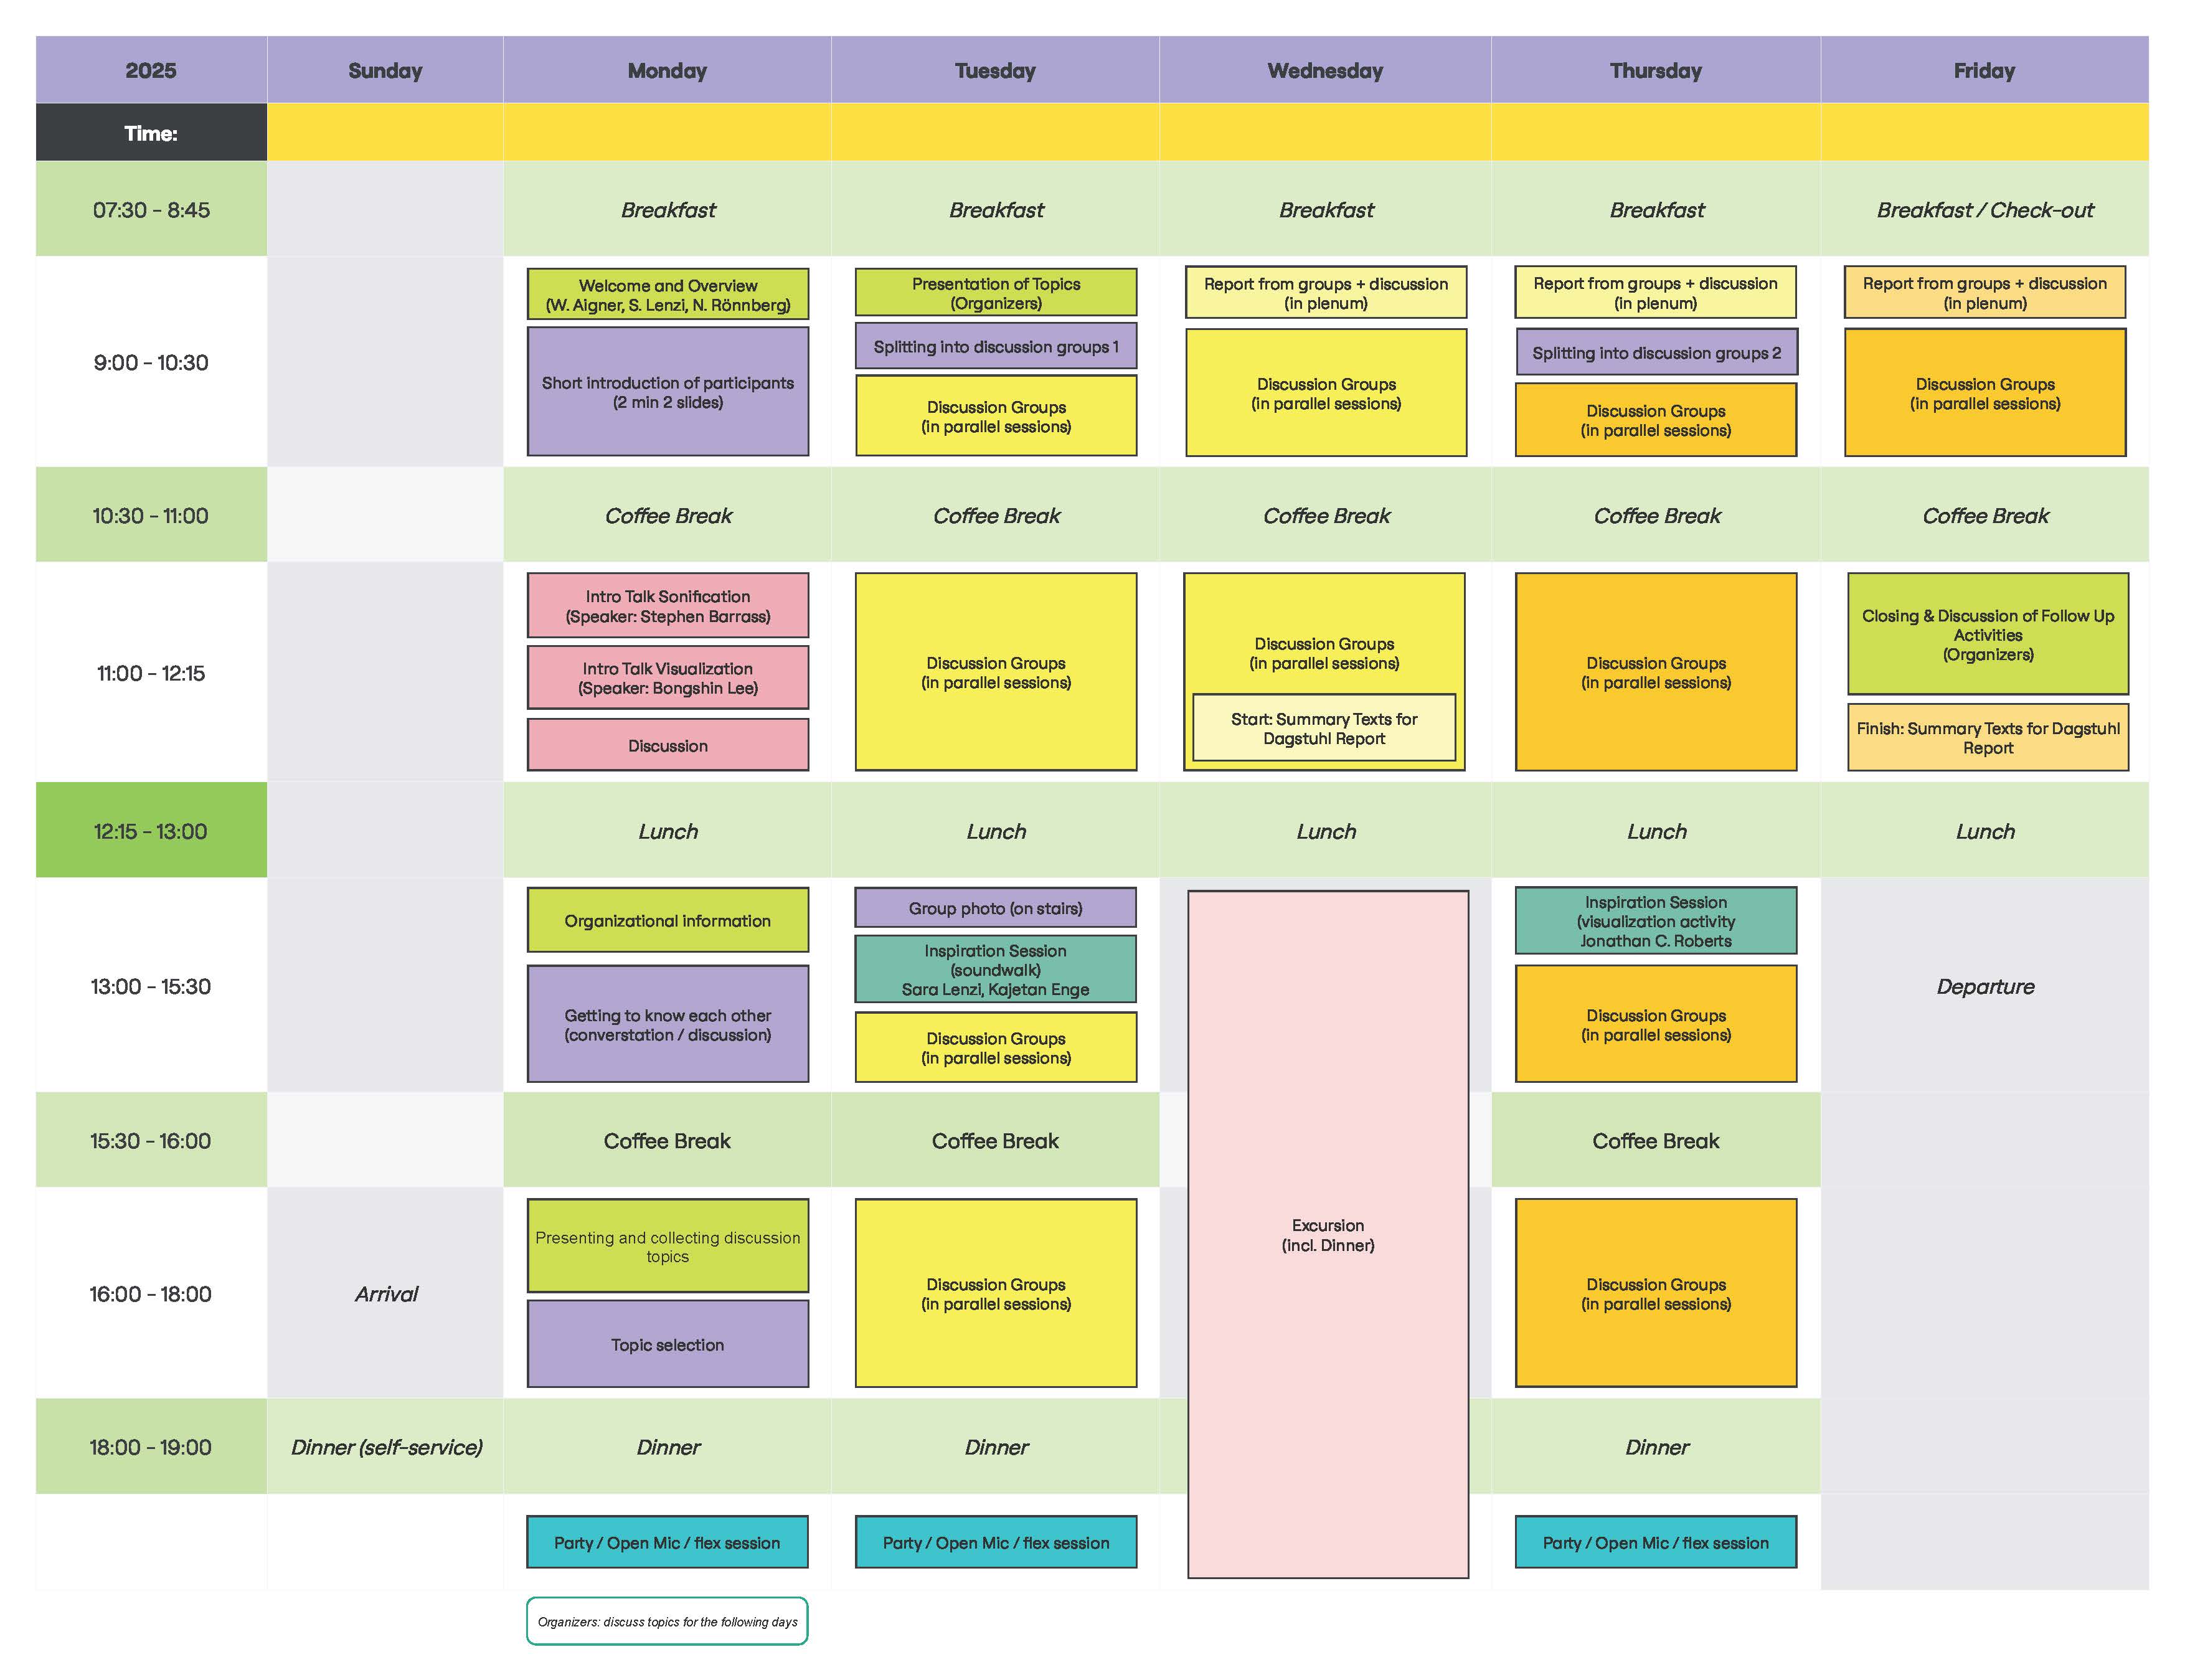
Figure 1 Schedule of the seminar.
The two inspirational sessions were designed as a light, engaging introduction for non-experts to visualization and sonification, and to provide a refreshing moment from the intense group discussions. In the evenings, participants gathered to showcase demos and current projects, exchange opinions on the respective fields, and overall enjoy each other’s company. The excursion to Völklinger Hütte was an intriguing break that helped participants connect more deeply with the region that will provide long-lasting memories for the participants.
The work started during the seminar is far from being complete. However, we felt that great progress was made to bring the two perspectives closer together. The need to define a common idiom was a first challenge that became easier as the week progressed. Both communities made efforts to understand each other, which also involved self-reflection on one’s field and open eyes and ears to the other’s. Groups focused on mapping the borders of each field and began defining the key terms as a necessary preliminary step to build a new joint perspective. The sections of this document will report on each group’s progress.
In a historical time when we as humans are dealing with the often overwhelming presence of data in our lives, and when researchers in the field carry the responsibility to facilitate sense-making of such data, this Dagstuhl Seminar has been widely recognised by participants as a milestone in establishing a common ground between the data visualization and data sonification community.
References
- Kajetan Enge, Elias Elmquist, Valentina Caiola, Niklas Rönnberg, Alexander Rind, Michael Iber, Sara Lenzi, Fangfei Lan, Robert Höldrich, and Wolfgang Aigner. Open Your Ears and Take a Look: A State-of-the-Art Report on the Integration of Sonification and Visualization. Computer Graphics Forum (EuroVis ’24), 43(3):e15114, 2024.
 Creative Commons BY 4.0
 Wolfgang Aigner, Sara Lenzi, and Niklas Rönnberg
In our daily lives, we as humans perceive our surroundings in an inherently multimodal way. Nevertheless, the vast majority of data analysis idioms are exclusively visual, not using the apparent potential of combined designs. While the visualization field studies visual data analysis solutions, the sonification field investigates comparable solutions that convey data over non-speech audio. There are several similarities between the methods and design theories of both approaches, such as the use of perceptual variables to encode data attributes, the use of marks and substrates for conveying items, and the role of interaction in manipulating the data representations.
Over the recent decades, both fields have established research communities, theoretical frameworks, and toolkit support. Although extensive research has been carried out both on the auditory and visual representation of data, comparatively little is known about their systematic and complementary combination for data exploration, analysis, and presentation. There are potential powerful synergies in combining both modalities to address the individual limitations of each other. Nevertheless, existing research on combinations has often focused only on one of the modalities.
To bridge this gap, the seminar will bring together researchers from the sonification and visualization communities. The seminar will deal with topics that arise from integrating visualization and sonification, as well as topics that are of concern for each field individually and can potentially contribute to both areas. In particular, the following questions will be discussed:
- What are the strengths of visualization and sonification respectively and how can they best be used in unison, complementing and supporting where necessary, considering human perception as well as various data properties?
- Which theoretical frameworks can be transferred from sonification to visualization and vice versa?
- Visualization has progressed much in the past decades towards shared design methods and tools: What can sonification learn from this lesson? Are shared design methods and processes envisageable, or even desired? Can we imagine integrated tools for visualization and sonification?
- In what way can audio-visual representations support accessibility of information and data?
- Can audio-visual representations increase the engagement of their users during a data analysis process?
- How can integrated sonification and visualization solutions be evaluated?
- Should integrated contributions be presented at existing visualization venues, sonification venues, or do we need new integrated venues?
The outcomes from these discussions will foster cross-fertilization and synergy of efforts by both fields, advance bimodal research on audio-visual analytics, and lay groundworks for multimodal approaches in the future.
Wolfgang Aigner, Sara Lenzi, and Niklas Rönnberg
- Wolfgang Aigner (FH - St. Pölten, AT) [dblp]
- Stephen Barrass (Sonification - Ainslie, AU) [dblp]
- Valentina Caiola (City University - Hong Kong, HK)
- Elias Elmquist (Linköping University, SE) [dblp]
- Kajetan Enge (Universität für Musik & darstellende Kunst - Graz, AT) [dblp]
- Mohammad Ghoniem (Luxembourg Inst. of Science & Technology, LU) [dblp]
- Christina Gillmann (Fraunhofer FIT - Sankt Augustin, DE) [dblp]
- Katharina Groß-Vogt (Universität für Musik & darstellende Kunst - Graz, AT) [dblp]
- Thomas Hermann (Universität Bielefeld, DE) [dblp]
- Michael Krone (University of Applied Sciences - Stuttgart, DE) [dblp]
- Bongshin Lee (Yonsei University - Seoul, KR) [dblp]
- Sara Lenzi (Universidad de Deusto - Bilbao, ES)
- Øystein Moseng (Highsoft AS - Vik I Sogn, NO)
- Dietmar Offenhuber (Northeastern University - Boston, US) [dblp]
- Sandra Pauletto (KTH Royal Institute of Technology - Stockholm, SE) [dblp]
- Alexander Rind (FH - St. Pölten, AT) [dblp]
- Jonathan C. Roberts (Bangor University, GB) [dblp]
- Niklas Rönnberg (Linköping University, SE) [dblp]
- Johanna Schmidt (TU Wien, AT) [dblp]
- Kelly Snook (Kepler Concordia - Yamaguchi, JP)
- Sita Vriend (Universität Stuttgart, DE) [dblp]
- Bruce N. Walker (Georgia Institute of Technology - Atlanta, US) [dblp]
- Jonathan Zong (MIT - Cambridge, US)
Classification
- Graphics
- Human-Computer Interaction
- Sound
Keywords
- Visualization
- Sonification
- Visual Analytics
- Auditory Display