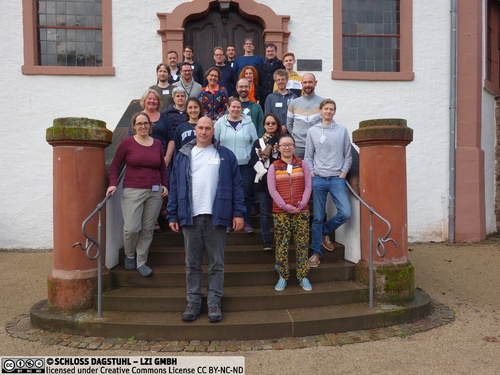
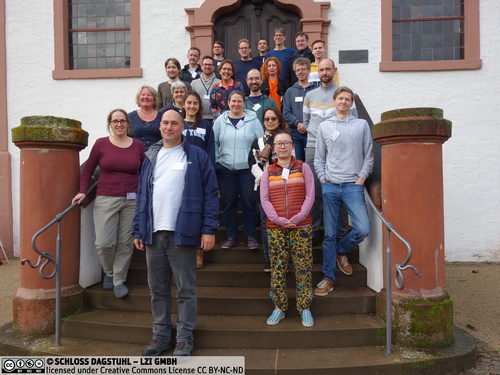
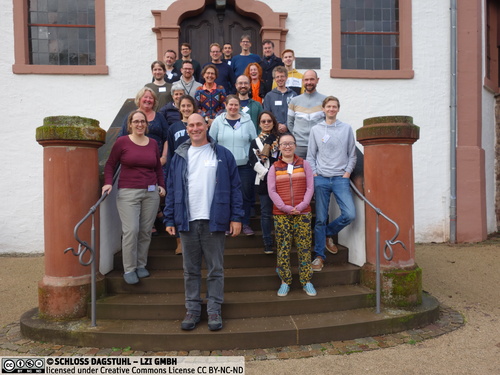
Dagstuhl Seminar 22462
Set Visualization and Uncertainty
( Nov 13 – Nov 18, 2022 )
Permalink
Organizers
- Susanne Bleisch (FH Nordwestschweiz - Muttenz, CH)
- Steven Chaplick (Maastricht University, NL)
- Jan-Henrik Haunert (Universität Bonn, DE)
- Eva Mayr (Donau-Universität Krems, AT)
- Marc van Kreveld (Utrecht University, NL)
Contact
- Michael Gerke (for scientific matters)
- Susanne Bach-Bernhard (for administrative matters)
Impacts
- Visualizing Uncertainty in Sets - Tominski, Christian; Behrisch, Michael; Bleisch, Susanne; Fabrikant, Sara Irina; Mayr, Eva; Purchase, Helen C.; Miksch, Silvia - Cornell University : arXiv.org, 2023. - 13 pp..
- Visualizing Uncertainty in Sets : article - Tominski, Christian; Behrisch, Michael; Bleisch, Susanne; Fabrikant, Sara Irina; Mayr, Eva; Purchase, Helen C.; Miksch, Silvia - Los Alamitos : IEEE, 2023. - pp. 49-61 - (IEEE computer graphics ; 43. 2023. 5).
- EulerMerge : Simplifying Euler Diagrams Through Set Merges - Yan, Xinyuan; Rodgers, Peter J.; Rottmann, Peter; Archambault, Daniel; Haunert, Jan-Henrik; Wang, Bei - Cornell University : arXiv.org, 2023. - 14 pp..
- Generating Euler Diagrams Through Combinatorial Optimization - Rottmann, Peter; Rodgers, Peter J.; Yan, Xinyuan; Archambault, Daniel; Wang, Bei; Haunert, Jan-Henrik - Aire-la-Ville : Eurographics Association, 2024. - 12 pp - (Computer graphics forum ; 43.2024, 3).
Schedule
Research Area
The topic of Set Visualization and Uncertainty is inherently interdisciplinary, combining aspects of several diverse fields. As such, the overview of the research area is split into the key fields associated with it; namely, information visualization, set systems, graph drawing, uncertainty (as applied to data sets), and cartography.
Information visualization (InfoVis) can help humans gain insight from large volumes of data by providing good graphical overviews as well as appropriate interfaces for accessing details (see, e.g., [1]). It has thus become of high relevance for industry and many scientific disciplines. Since the generation of effective visualizations requires knowledge of human cognition, algorithms, data characteristics, visual variables, and tasks, the InfoVis community embraces members of various disciplines, including computer scientists of different areas, cognitive scientists, psychologists, and cartographers.
Sets are mathematically defined as unordered collections of distinct objects. They play an important role in InfoVis since reasoning based on aggregated information (i.e., sets instead of individual objects) can greatly reduce the complexity of data analysis tasks. Most often, the sets are defined by categories of objects; e.g., people can be grouped by country of residence, education, or gender to study influences on income. Often, the aim is to visualize statistics (e.g., number of elements, average income) for each set and, since an element can be member of multiple sets, the relationships between them (e.g., intersection and containment). Set visualization is traditionally done with Venn or Euler diagrams, yet a plethora of alternative visualization types for sets has been developed. A recent focus of research has been on developing scalable solutions (e.g., to create effective visualizations for very large set systems) and dealing with dynamics (e.g., changes of the elements' set memberships over time). In this seminar we dealt with a different issue, already relevant for static and small set systems: uncertainty. Although the importance of uncertainty visualization has been stressed by several researchers, only few studies exist that deal with it specifically in the context of sets and systems of sets [3].
Uncertainty is inherent to almost any information collected through observations by humans or sensors. Since the assignment of elements to categories corresponding to sets follows observations, the set memberships are uncertain, too. Moreover, subsuming multiple elements with their individual properties under one category results in a loss of information. Although this information reduction may be intended to reduce the graphical complexity, visualizing the within-set as well as the between-set variability may improve the interpretation of the data. Uncertainty is usually evaluated with statistical methods or concepts of probability. Uncertainty can relate to the existence of an element, the existence of a set, the presence of an element in a set, set containment in hierarchies, location of an object in geo-located data, etc. Moreover, uncertainty can be given as a binary property or as a probability. Fuzzy set theory extends the idea of sets by allowing partial set membership, indicated by a value between 0 and~1. This model has been proposed for concepts that lack crisp boundaries (e.g., "young" and "old" as categories of people). In InfoVis, an important question is whether and how the uncertainty of the information displayed should be visually encoded (e.g., with glyphs or graphical variables), and how users process this visualization of uncertainty [2]. Moreover, although the uncertainty may not be depicted, it may be considered when generating a visualization (e.g., by filtering information based on its certainty). Conversely, a standard visualization like a heat map suggests uncertainty which may not exist in the data at all.
Graph drawing is a branch of computer science focusing on the computation of geometric layouts of graphs, involving both formal and experimental methods. Since graphs are useful mathematical models for networks, graph drawing is of high relevance for network visualization. Graph drawing can be applied to non-geometric networks (e.g., social networks consisting of friendship relationships) as well as to geometric networks (e.g., networks of metro lines) if the aim is to generate more abstract (e.g., schematic) representations. Since a system of sets can be considered as a hypergraph in which each node corresponds to one entity and each hyperedge corresponds to one set, set visualization is fundamental in the graph drawing community. However, aspects of uncertainty remain mostly unexplored [4].
Geographic information is a combination of geometric, temporal, and attribute information, each of which can be uncertain in different ways and can be visualized in different ways commonly through maps. Cartographyand its sister discipline Geographic Information Science have a long history in dealing with uncertainty in the context of analyzing and visualizing spatial information. For example, international standards formalizing elements of spatial data quality have been established (e.g., ISO 19157:2013 defining thematic accuracy, temporal quality, positional accuracy) and graphical variables encoding the uncertainty of information in maps have been proposed, including color saturation and symbol focus [5].
Seminar Goals
This seminar aimed to advance research into methods and techniques for set visualizations and uncertainty by fostering interdisciplinary and cross-domain collaboration (cf. section Research Area). Sets are mathematically defined as collections of distinct objects. They play an important role in Information Visualization since reasoning based on aggregated information can reduce the complexity of the analysis tasks. Uncertainty is inherent to almost any information collected through observations by humans or sensors and, thus, also set elements or their set membership. Uncertainty generally adds to the complexity of data analysis and data presentation. In the seminar we looked specifically into approaches for dealing with uncertain information when visualizing sets. Information Visualization has some established techniques regarding uncertainty. However, the topic is -- except for some specific cases (cf. Fig. 1) -- mostly unexplored in the context of set visualizations. Some uncertainty visualization techniques may directly apply to set visualizations. In this seminar we brought together researchers from the areas of information visualization, visual analytics, graph drawing, geoinformation science, uncertainty research, and cognitive~science. These interdisciplinary participants formed working groups to consider selected problems of considering and visualising uncertainty associated with sets so that the visualizations are informative and reliable, in the sense that humans can use them for visual analysis tasks and that the uncertain information is recognizable.
![Examples of uncertainty visualizations for sets from [6, 7, 8, 9, 10, 11] (from top left to
bottom right).](/storage/media/0005/5566/set_uncertainty.png)
Seminar Format
The interdisciplinary topic of the seminar, as well as the different scientific backgrounds of the participants, asked for an introduction to the main topics as well as to selected perspectives through invited talks on the first day. The structure of two talks in the morning and two in the afternoon of the first day left enough room for first discussions. The day ended with participants' pitches of open problems and the participants indicating their interest in the pitched problems.
Invited talks of the first day:
- Daniel Archambault: Drawing Euler Diagrams with Closed Curves
- Wouter Meulemans: Algorithmic Perspectives on Uncertainty and Set Visualization
- Bei Wang Phillips: Visualizing Hypergraphs: With Connections to Uncertainty Visualization
- Martin Kryzwinski: Genomes: sets of sets of sets
The second day of the seminar was started with the formation of four groups interested in four different open problems. Each group worked on their specific open problem for the remainder of the seminar. Participants were invited to give mini-talks related to the seminar topic. Time was reserved for those contributed talks every morning. Additionally, the working groups reported on their progress on Wednesday and Friday.
Contributed mini-talks throughout the week (given are the names of the presenters, see Overview of Talks for full list of contributors):
- Annika Bonerath & Markus Wallinger: MosaicSets
- Sara Irina Fabrikant: How to visualize uncertainty
- Silvia Miksch: Visual Encodings of Temporal Uncertainty: A Comparative User Study
- Nathan van Beusekom: Simultaneous Matrix Orderings for Graph Collections
- Marc van Kreveld: On Full Diversity in Metric Spaces
- Alexander Wolff: StoryLines
Outcomes and Future Plans
The participants were highly satisfied with the quality of the seminar. Diverse interdisciplinary discussions took place and all groups worked well together. The final progress reports of the working groups indicate that the collaborations will be ongoing and some papers will be published (cf. section Working Groups).
At the final day plenary meeting, plans for a follow-up seminar were discussed. A group of interested participants is currently discussing the focus and title of such a seminar.
References
- Munzner, T. (2014). Visualization Analysis & Design. Boca Raton: CRC Press.
- Padilla, L. and Kay, M. and Hullman, J. (2021). Uncertainty Visualization in Wiley StatsRef: Statistics Reference Online. Eds. N. Balakrishnan and T. Colton and B. Everitt and W. Piegorsch and F. Ruggeri and J.L. Teugels, Wiley. doi:10.1002/9781118445112.
- Alsallakh, Bilal and Micallef, Luana and Aigner, Wolfgang and Hauser, Helwig and Miksch, Silvia and Rodgers, Peter (2016). The State-of-the-Art of Set Visualization. Computer Graphics Forum, 35(1):234–260. doi:10.1111/cgf.12722.
- Steven Chaplick and Takayuki Itoh and Giuseppe Liotta and Kwan-Liu Ma and Ignaz Rutter (2020). Trends and Perspectives in Graph Drawing and Network Visualization, NII Shonan Meeting Report 171. https://shonan.nii.ac.jp/docs/ 342e2e86373d4783ae00063ddd67e8b35b9d75d5.pdf.
- MacEachren, Alan M. and Robinson, Anthony and Hopper, Susan and Gardner, Steven and Murray, Robert and Gahegan, Mark and Hetzler, Elisabeth (2005). Visualizing Geospatial Information Uncertainty: What We Know and What We Need to Know. Cartography and Geographic Information Science, 32(3):139–160. doi:10.1559/1523040054738936.
- Görtler, Jochen and Schulz, Christoph and Weiskopf, Daniel and Deussen, Oliver (2018). Bubble Treemaps for Uncertainty Visualization. IEEE Transactions on Visualization and Computer Graphics, 24(1):719–728. doi:10.1109/TVCG.2017.2743959.
- Sondag, Max and Meulemans, Wouter and Schulz, Christoph and Verbeek, Kevin and Weiskopf, Daniel and Speckmann, Bettina (2020). Uncertainty Treemaps. 2020 IEEE Pacific Visualization Symposium (PacificVis), 111–120. IEEE.
- Xu, Kai and Salisu, Saminu and Nguyen, Phong H. and Walker, Rick and Wong, B. L. William and Wagstaff, Adrian and Phillips, Graham and Biggs, Mike and Potel, Mike (2020). TimeSets: Temporal Sensemaking in Intelligence Analysis. IEEE Computer Graphics and Applications, 40(3):83–93. doi:10.1109/MCG.2020.2981855.
- Zhu, Lifeng and Xia, Weiwei and Liu, Jia and Song, Aiguo (2018). Visualizing fuzzy sets using opacity-varying freeform diagrams. Information Visualization, 17(2):146–160.doi: 10.1177/1473871617698517.
- Vullings, L. A. E. and Blok, C. A. and Wessels, C. G. A. M. and Bulens, J. D. (2013). Dealing with the uncertainty of having incomplete sources of geo-information in spatial planning. In Applied spatial analysis and policy, 6(1):25–45. Springer.
- Vehlow, Corinna and Reinhardt, Thomas and Weiskopf, Daniel (2013). Visualizing Fuzzy Overlapping Communities in Networks. IEEE Transactions on Visualization and Computer Graphics, 19(12):2486–2495. doi:10.1109/TVCG.2013.232.
 Susanne Bleisch, Steven Chaplick, Jan-Henrik Haunert, Eva Mayr, and Marc van Kreveld
Information Visualization (InfoVis) can help humans gain insight from large volumes of data by providing graphical overviews as well as appropriate interfaces for accessing details. Sets, which are mathematically defined as collections of distinct objects, play an important role in InfoVis since reasoning based on grouped information can reduce the complexity of data analysis tasks. Most often, sets are defined by categories of objects; e.g., people can be categorized by country of residence, education, or gender to study influences on income. Often, the aim is to visualize statistics (e.g., number of elements, average income) for each set and, since an element can be member of multiple sets, the relationships between them (e.g., intersection and containment). Set visualization is traditionally done with Venn or Euler diagrams, yet a plethora of alternative visualization types for sets has been developed. A recent focus of research has been on developing scalable solutions (e.g., to create effective visualizations for very large set systems) and dealing with dynamics (e.g., changes of the elements’ set memberships over time). In this Dagstuhl Seminar we deal with a different issue: uncertainty. We aim to develop approaches to deal with uncertain information when visualizing sets. Although the importance of uncertainty visualization has been stressed by several researchers, only few studies exist that deal with it specifically in the context of sets and systems of sets.
Some existing uncertainty visualization techniques may directly apply to set visualizations. However, we argue that an interdisciplinary approach, considering uncertainty at any stage of dealing with sets, will lead to more useful and usable set visualizations. Key challenges include uncertainty-aware set visualizations, visualizing uncertainty in sets, modeling uncertainty for set visualizations, geographical set visualizations under relaxed geometrical constraints, and reasoning with such set visualizations including uncertainty. Addressing these challenges will require design and efficient generation of visualizations that are informative and reliable, in the sense that humans can use them for visual analysis tasks and that the uncertain information is recognizable.
The seminar aims to advance research into methods and techniques for set visualizations and uncertainty by fostering interdisciplinary and cross-domain collaboration. It aims to bring together researchers from the areas of information visualization, visual analytics, graph drawing, computational geometry, geoinformation science, uncertainty research, and cognitive science.
 Susanne Bleisch, Steven Chaplick, Jan-Henrik Haunert, Eva Mayr, and Marc van Kreveld
- Daniel Archambault (Swansea University, GB) [dblp]
- Michael Behrisch (Utrecht University, NL) [dblp]
- Susanne Bleisch (FH Nordwestschweiz - Muttenz, CH) [dblp]
- Annika Bonerath (Universität Bonn, DE) [dblp]
- Steven Chaplick (Maastricht University, NL) [dblp]
- Sara Irina Fabrikant (Universität Zürich, CH) [dblp]
- Amy Griffin (RMIT University - Melbourne, AU) [dblp]
- Jan-Henrik Haunert (Universität Bonn, DE) [dblp]
- Stephen Kobourov (University of Arizona - Tucson, US) [dblp]
- Martin Krzywinski (BC Cancer Research Centre - Vancouver, CA) [dblp]
- Eva Mayr (Donau-Universität Krems, AT) [dblp]
- Wouter Meulemans (TU Eindhoven, NL) [dblp]
- Silvia Miksch (TU Wien, AT) [dblp]
- Martin Nöllenburg (TU Wien, AT) [dblp]
- Helen C. Purchase (Monash University - Clayton, AU) [dblp]
- Peter Rodgers (University of Kent - Canterbury, GB) [dblp]
- Christian Tominski (Universität Rostock, DE) [dblp]
- Nathan Van Beusekom (TU Eindhoven, NL)
- Marc van Kreveld (Utrecht University, NL) [dblp]
- Markus Wallinger (TU Wien, AT)
- Bei Wang Phillips (University of Utah - Salt Lake City, US) [dblp]
- Alexander Wolff (Universität Würzburg, DE) [dblp]
- Hsiang-Yun Wu (FH - St. Pölten , AT) [dblp]
Classification
- Data Structures and Algorithms
- Human-Computer Interaction
- Social and Information Networks
Keywords
- information visualization
- uncertainty
- set visualization
- cartography
- graph drawing


 Creative Commons BY 4.0
