Dagstuhl Seminar 19192
Visual Analytics for Sets over Time and Space
( May 05 – May 10, 2019 )
(Click in the middle of the image to enlarge)
Permalink
Please use the following short url to reference this page:
https://www.dagstuhl.de/19192
Organizers
- Sara Irina Fabrikant (Universität Zürich, CH)
- Silvia Miksch (TU Wien, AT)
- Alexander Wolff (Universität Würzburg, DE)
Contact
- Andreas Dolzmann (for scientific matters)
Impacts
- ClusterSets : Optimizing Planar Clusters in Categorical Point Data : article - Geiger, Jakob; Cornelsen, Sabine; Haunert, Jan-Henrik; Kindermann, Philipp; Mchedlidze, Tamara; Nöllenburg, Martin; Okamoto, Yoshio; Wolff, Alexander - Aire-la-Ville : Eurographics Association, 2021 - (Computer graphics forum ; 40. 2021, 3).
- Computing Schematic Layouts for Spatial Hypergraphs on Concentric Circles and Grids - Bekos, Michael A.; Dekker, D. J. C.; Frank, F.; Meulemans, Wouter; Rodgers, Peter J.; Schulz, Andre; Wessel, S. - Aire-la-Ville : Eurographics Association, 2022. - pp. 316-335 - (Computer graphics forum ; 41. 2022, 6).
- Concentric set schematization : article - Bekos, Michael A.; Frank, Fabian; Meulemans, Wouter; Rogers, Peter; Schulz, Andre - Eindhoven : University, 2019. - 2 pp..
- Toward flexible visual analytics augmented through smooth display transitions : article - Tominski, Christian; Andrienko, Gennady; Andrienko, Natalia V.; Bleisch, Susanne; Mayr, Eva; Skupin, Andre; Pohl, Margit; Miksch, Silvia; Fabrikant, Sara Irina - Amsterdam : Elsevier, 2021. - Pages 28-38 - (Visual informatics ; 5. 2021, 3).
Schedule
Set systems are the generic data model for families of sets. A set is a collection of unique objects, called elements. An element may have attributes, membership functions, and rules. Such a complex data model asks for appropriate exploration methods. As with many types of data, set systems can vary over time and space. It is important, however, not to treat time and space as usual variables. Their special characteristics such as different granularities, time primitives (time points vs. intervals), hierarchies of geographic or administrative regions need to be taken into account. Visualizing and analyzing such changes is challenging due to the size and complexity of the data sets.
Sets systems can also be seen as hypergraphs where the vertices represent the ground elements and the edges are the sets. However, compared to conventional graphs that represent only binary relations (that is, sets with two elements), the visualization of general hypergraphs has received little attention. This is even more so when dealing with dynamic hypergraphs or hypergraphs that represent spatial information.
The main goal of this Dagstuhl Seminar is to foster co-operation and share knowledge between researchers with interests in set visualization coming from various different communities. Useful and usable set visualization can help us to better understand the underlying relationships in real-world categorical data sets. It can also allow for the discovery of patterns and the forecast of future trends in increasingly non-quantitative open datasets available online. Most existing approaches, methods, and tools, however, focus on static set systems and are limited in taking the complexity of temporal and geospatial characteristics into account. Therefore, we want:
- To bring together researchers working on visualization (i) from a theoretical point of view (graph drawing, computational geometry, and cognition), (ii) from a temporal point of view (visual analytics and information visualization over time, HCI), and (iii) from a space-time point of view (cartography, GIScience).
- To identify specific theoretical and practical problems that need to be solved in order to create dynamic and interactive set visualizations that take into account time and space. (We want to begin working on these problems during the seminar.)
- To formulate our findings as first steps to solving the problems under consideration and to define future research directions.
The format of the seminar will allow for presentations as well as planned and ad-hoc problem- solving sessions, with the intention of promoting exchange between the participants of diverse scientific backgrounds and to encourage the work on specific open problems. The first 1.5 days will be reserved for overview presentations from representatives of the different communities, for presenting open problems, and for forming interdisciplinary working groups that will focus on some of the identified open problems as a group. The remaining three days will comprise of working-group meetings and progress reports.
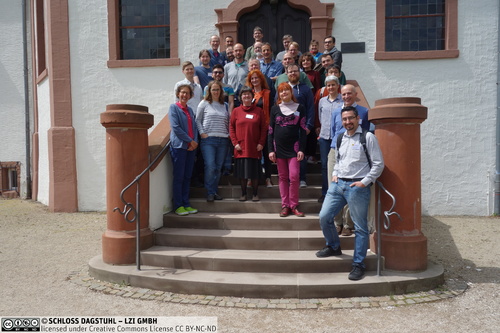
 Creative Commons BY 3.0 DE
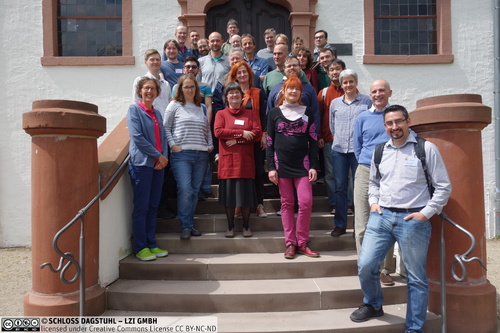
 Sara Irina Fabrikant, Silvia Miksch, and Alexander Wolff
Seminar Goals
Increasing amounts of data offer great opportunities to promote technological progress and business success. Visual analytics aims at enabling the exploration and the understanding of large and complex data sets by intertwining interactive visualization, data analysis, human-computer interaction, as well as cognitive and perceptual science. Cartography has for thousands of years dealt with the depiction of spatial data, and more recently geovisual analytics researchers have joined forces with the visual analytics community to create visualizations to help people to make better and faster decisions about complex problems that require the analysis of big data.
Set systems comprise a generic data model for families of sets. A set is defined as a collection of unique objects, called the set elements, with attributes, membership functions, and rules. Such a complex data model asks for appropriate exploration methods. As with many types of data, set systems can vary over time and space. It is important, however, not to treat time and space as usual variables. Their special characteristics such as different granularities, time primitives (time points vs. intervals), hierarchies of geographic or administrative regions need to be taken into account. Visualizing and analyzing such changes is challenging due to the size and complexity of the data sets.
Sets systems can also be seen as hypergraphs where the vertices represent the ground elements and the edges are the sets. However, compared to conventional graphs that represent only binary relations (that is, sets with two elements), the visualization of general hypergraphs has received little attention. This is even more so when dealing with dynamic hypergraphs or hypergraphs that represent spatial information.
In this seminar, we aimed at bringing together researchers from the areas of visual analytics, information visualization and graph drawing, geography and GIScience, as well as cartography and (spatial) cognition, in order to develop a theory and visualization methods for set systems that vary over time and space.
Seminar Program
As the topic of the seminar was interdisciplinary and the participants had very different scientific backgrounds, we introduced the main themes of the seminar in three separate sections: “Sets in Time”, “Sets in Space”, and “Graph Drawing and Set Visualization”. Each section consisted of a survey talk and three to four short talks. The three sections were followed by a panel discussion. For the survey talks, we explicitly asked the presenters to give a balanced overview over their area (rather than to focus on their own scientific contributions).
On the second day of the seminar, we collected a number of challenging open problems. Then we formed five groups, each of which worked on a specific open problem for the remainder of the seminar. The work within the groups was interrupted only a few times; in order to share progress reports, listen to open-mic talks, and to discuss possible future activities. These plenary meetings helped to exchange the different visions of the working groups.
We now list the items of the program in detail.
- Section "Sets in Time" (for abstracts, see Section 3)
- Peter Rogers gave an excellent survey talk about techniques for visualizing sets over time. He illustrated possible challenges and opportunities in this research area.
- Philipp Kindermann presented some results and open questions in simultaneous orthogonal graph drawing.
- Wouter Meuleman talked about spatially and temporally coherent visual summaries.
- Tamara Mchedlidze introduced a data-driven approach to quality metrics of graph visualizations.
- Margit Pohl discussed perception considerations of space and time in cognitive psychology and their implications for the design of visualizations.
- Section ``Sets in Space'' (for abstracts, see Section 4)
- Sara Fabrikant gave an inspiring survey talk about space discussed from a cartographer‘s view.
- Natalia Andrienko elaborated about evolving sets in space.
- Somayeh Dodge discussed dynamic visualization of interaction in movement of sets.
- Jan-Henrik Haunert introduced fast retrieval of abstracted representations for sets of points within user-specified temporal ranges.
- Section "Graph Drawing and Set Visualization" (for abstracts, see Section 5)
- André Schulz very nicely surveyed the area of drawing graphs and hypergraphs and sketched the main challenges in this area.
- Michalis Bekos gave a short overview of graph drawing beyond planarity.
- Sabine Cornelsen talked about general support for hypergraphs.
- Martin Nöllenburg introduced plane supports for spatial hypergraphs.
- The panel discussion was entitled "Visual Analytics for Sets over Time and Space: What are the burning scientific questions? An interdisciplinary perspective." André Skupin, Steven Kobourov, and Susanne Bleisch each gave a short statement about the central questions of his or her area; see Section 6. Afterwards we had a fruitful and interesting discussion, which led to a productive open problem session.
- The working groups formed around the following open problems:
- "Concentric Set Schematization",
- "From Linear Diagrams to Interval Graphs",
- "Thread Visualization",
- "Clustering Colored Points in the Plane", and
- "Flexible Visualization of Sets over Time and Space".
The reports of the working groups were collected by Michalis Bekos, Steven Chaplick, William Evans, Jan-Henrik Haunert, and Christian Tominski; see Section 7.
Future Plans
During our seminar, plans for a follow-up seminar were discussed in a plenary meeting. The seminar-to-be will aim at integrating the approaches for set visualization that have been taken by the different communities (geovisualization, information visualization, and graph drawing, including industry and research). Susanne Bleisch, Steven Chaplick, Jan-Henrik Haunert, and Eva Mayr are currently discussing the precise focus and a title to match that focus.
Among the 29 participants of the seminar, 24 participated in the survey that Dagstuhl does at the end of every seminar. Many answers were in line with the average reactions that Dagstuhl collected over a period of 60 days before our seminar (such as the scientific quality of the seminar, which received a median of 10 out of 11 – “outstanding”). A few questions, however, received different feedback. For example, due to the interdisciplinary nature of the seminar, we had more frequent Dagstuhl visitors than usually: a third of the participants of the survey had been to Dagstuhl at least seven times. It was also interesting to see that more participants than usually stated that our seminar had inspired new research ideas, joint projects or publications, that it had led to insights from neighboring fields, and that it had identified new research directions.
In spite of the organizers’ attempt to have a diverse group of participants, all survey participants were from academia and only two rated themselves as “junior”. Not surprisingly, some participants suggested to have more PhD students, more people from industry, and generally more people from applications rather than from (graph drawing) theory. The last free text comment in the survey reads: “Once again, a great week at Schloss Dagstuhl – thank you!”
Aknowledgements
We all enjoyed the unique Dagstuhl atmosphere. In particular, it was great to have the opportunity to use a separate room for each working group. We thank Philipp Kindermann for collecting the self-introductory slides before the seminar and for assembling this report after the seminar.
Sara Irina Fabrikant, Silvia Miksch, and Alexander Wolff
- Hugo Akitaya (Tufts University - Medford, US) [dblp]
- Gennady Andrienko (Fraunhofer IAIS - Sankt Augustin, DE) [dblp]
- Natalia V. Andrienko (Fraunhofer IAIS - Sankt Augustin, DE) [dblp]
- Michael A. Bekos (Universität Tübingen, DE) [dblp]
- Susanne Bleisch (FH Nordwestschweiz - Muttenz, CH) [dblp]
- Steven Chaplick (Universität Würzburg, DE) [dblp]
- Sabine Cornelsen (Universität Konstanz, DE) [dblp]
- Somayeh Dodge (University of Minnesota - Minneapolis, US) [dblp]
- William Evans (University of British Columbia - Vancouver, CA) [dblp]
- Sara Irina Fabrikant (Universität Zürich, CH) [dblp]
- Fabian Frank (University of Arizona - Tucson, US)
- Panos Giannopoulos (City - University of London, GB) [dblp]
- Jan-Henrik Haunert (Universität Bonn, DE) [dblp]
- Michael Kaufmann (Universität Tübingen, DE) [dblp]
- Philipp Kindermann (Universität Würzburg, DE) [dblp]
- Stephen Kobourov (University of Arizona - Tucson, US) [dblp]
- Giuseppe Liotta (University of Perugia, IT) [dblp]
- Eva Mayr (Donau-Universität Krems, AT) [dblp]
- Tamara Mchedlidze (KIT - Karlsruher Institut für Technologie, DE) [dblp]
- Wouter Meulemans (TU Eindhoven, NL) [dblp]
- Silvia Miksch (TU Wien, AT) [dblp]
- Martin Nöllenburg (TU Wien, AT) [dblp]
- Yoshio Okamoto (The University of Electro-Communications - Tokyo, JP) [dblp]
- Margit Pohl (TU Wien, AT) [dblp]
- Peter Rodgers (University of Kent - Canterbury, GB) [dblp]
- André Schulz (FernUniversität in Hagen, DE) [dblp]
- André Skupin (San Diego State University, US) [dblp]
- Christian Tominski (Universität Rostock, DE) [dblp]
- Alexander Wolff (Universität Würzburg, DE) [dblp]
Classification
- data structures / algorithms / complexity
- networks
- society / human-computer interaction
Keywords
- information visualization
- visual analytics
- set visualization
- geovisualization
- cartography
- graph drawing