Dagstuhl Seminar 19292
Mobile Data Visualization
( Jul 14 – Jul 19, 2019 )
(Click in the middle of the image to enlarge)
Permalink
Please use the following short url to reference this page:
https://www.dagstuhl.de/19292
Organizers
- Eun Kyoung Choe (University of Maryland - College Park, US)
- Raimund Dachselt (TU Dresden, DE)
- Petra Isenberg (INRIA Saclay - Orsay, FR)
- Bongshin Lee (Microsoft Research - Redmond, US)
Contact
- Michael Gerke (for scientific matters)
- Annette Beyer (for administrative matters)
Dagstuhl Seminar Wiki
- Dagstuhl Seminar Wiki (Use personal credentials as created in DOOR to log in)
Shared Documents
- Dagstuhl Materials Page (Use personal credentials as created in DOOR to log in)
Despite recent advances in pen- and/or touch-enabled mobile devices and the rapid adoption of these devices in everyday life, we are far from leveraging the full potential of mobile devices in satisfying the growing demand for visual access to data. Even though the design space for mobile data visualization is emerging out of everyday practice, concentrated research efforts and a consolidated set of best practices have not yet emerged.
Over the past few decades, the visualization research community has developed a large set of recommendations for visualization development on a variety of devices. However, how these recommendations scale (down) to mobile devices is underexplored and thus mostly unknown. Practitioners largely rely on their design intuition to solve known challenges such as labeling, color coding for small data items, fat finger problems, low data and visualization literacy among their target audience, or the absence of mouse-over interaction, which is prevalent in interactive visualization systems in the desktop environment.
Both mobile visualization research and practice face shared problems, such as how to adapt and optimize data representations to small displays; how to support novel and effective interactions with small data representations; and how to best use mobile devices in a device ecosystem and with multiple collaborators. Yet, new challenges continue to emerge as data visualization techniques are adopted and used for novel mobile applications. In addition, new form factors and hardware capabilities will emerge in the coming years. Thus, it would be beneficial for multiple research communities to take stock of what has been discovered to date and to look to the future.
An immediate goal of this Dagstuhl Seminar is thus to identify open problems that need further investigation and to identify priorities for future research in this space. In addition, we want to collect and propagate actionable guidance for mobile app designers and developers. We would like to put an emphasis on the following research questions during the workshop:
- What are the mobile-inherent and application-specific challenges in designing and evaluating interfaces for visualizing and exploring data on mobile devices?
- How can we address these challenges?
- What are new and exciting ways to use mobile devices for data visualization?
Additionally, we want to bring participants with diverse backgrounds together to identify the most pressing mobile visualization research challenges that evolve out of practice and to establish opportunities for future collaboration. Through the involvement from multiple application domains, we want to synthesize and share best practices from a variety of domains. Relevant application and research fields include visualization, mobile interaction design, personal health, emergency response, and data journalism.
 Creative Commons BY 3.0 DE
 Eun Kyoung Choe, Raimund Dachselt, Petra Isenberg, and Bongshin Lee
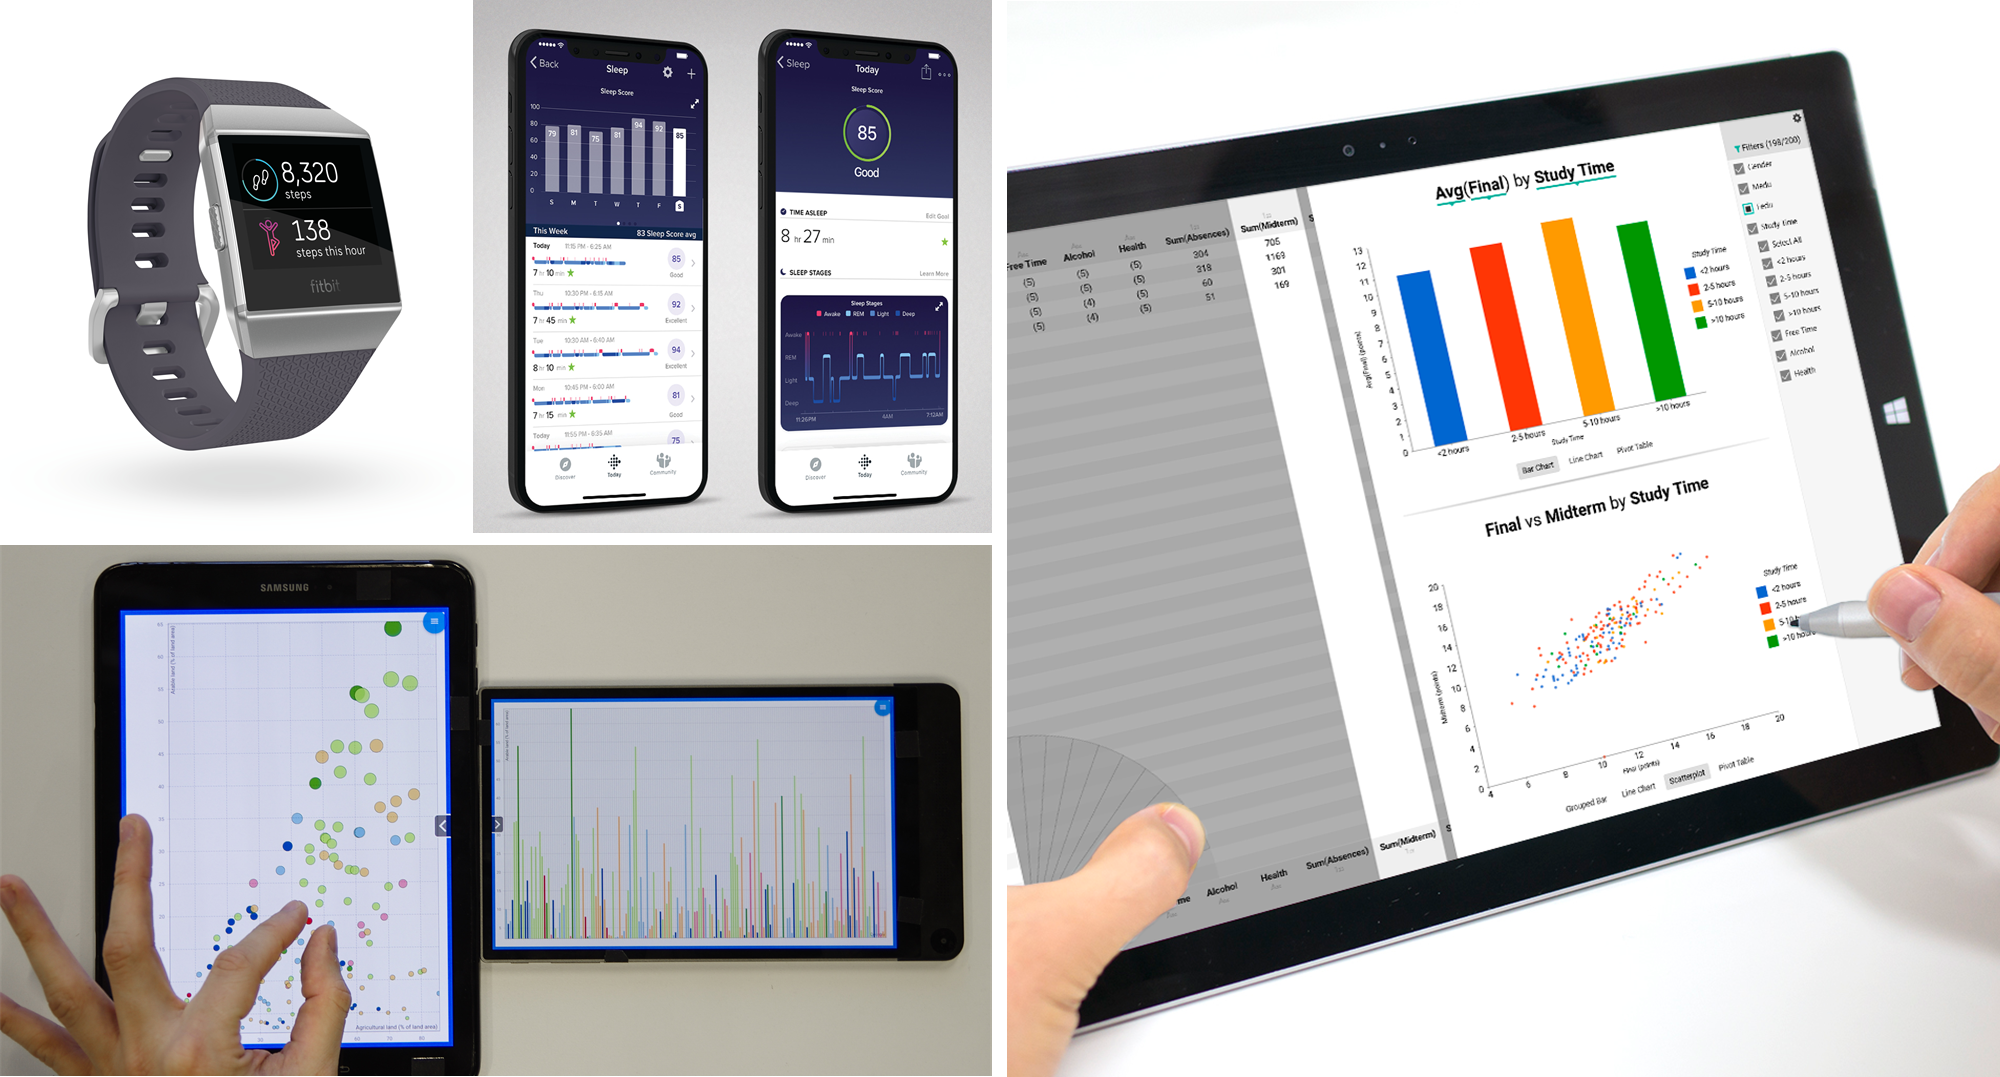
As pen- and/or touch-enabled mobile devices have become more powerful and ubiquitous, we see a growing demand for mobile data visualization to facilitate visual access to data on mobile devices (see Figure 1 for examples). Lay people increasingly access a wide range of data, including weather, finance, and personal health on their phone. Small business owners start to use business intelligence software equipped with data visualization on mobile devices to make better business decisions. In responding to these needs, practitioners have actively been designing mobile visualizations embedded in commercial systems. However, research communities, such as Human-Computer Interaction (HCI), Information Visualization (InfoVis), and Ubiquitous Computing (UbiComp) have not paid enough attention to mobile data visualization.
Over the past few decades, the visualization research community has conducted extensive research, designing and developing a large number of visualization techniques and systems mostly for a desktop environment. However, the accumulated knowledge may not be readily transferable to mobile devices due to their fundamental differences in their display size, interaction, and target audience, among others. The small display on mobile devices is more vulnerable to the scalability issue and poses a well-known challenge, the fat finger problem. Mouse-over interaction, which is prevalent in interactive visualization systems in the desktop environment, is not available on mobile devices. While traditional visualizations mainly target data-savvy groups of people such as scientists and researchers, visualizations on mobile devices should account for a broader range of target audience, including lay people who might have low data and visualization literacy.
This Dagstuhl seminar follows in the footsteps of the ``Data Visualization on Mobile Devices'' workshop at CHI 2018, our initial effort in establishing a community around mobile data visualization. We brought researchers and practitioners from relevant application and research fields, including InfoVis, UbiComp, mobile HCI, and interaction design to exchange information and experiences, to stimulate discussion, to make new connections, and to identify novel ideas and future directions around mobile data visualization.
Unlike the CHI workshop, this five-day Dagstuhl workshop enabled us to explore mobile data visualization in depth through speedy & intense research exchanges, interactive demos & tutorials, as well as active breakout group discussions.
The Week at a Glance
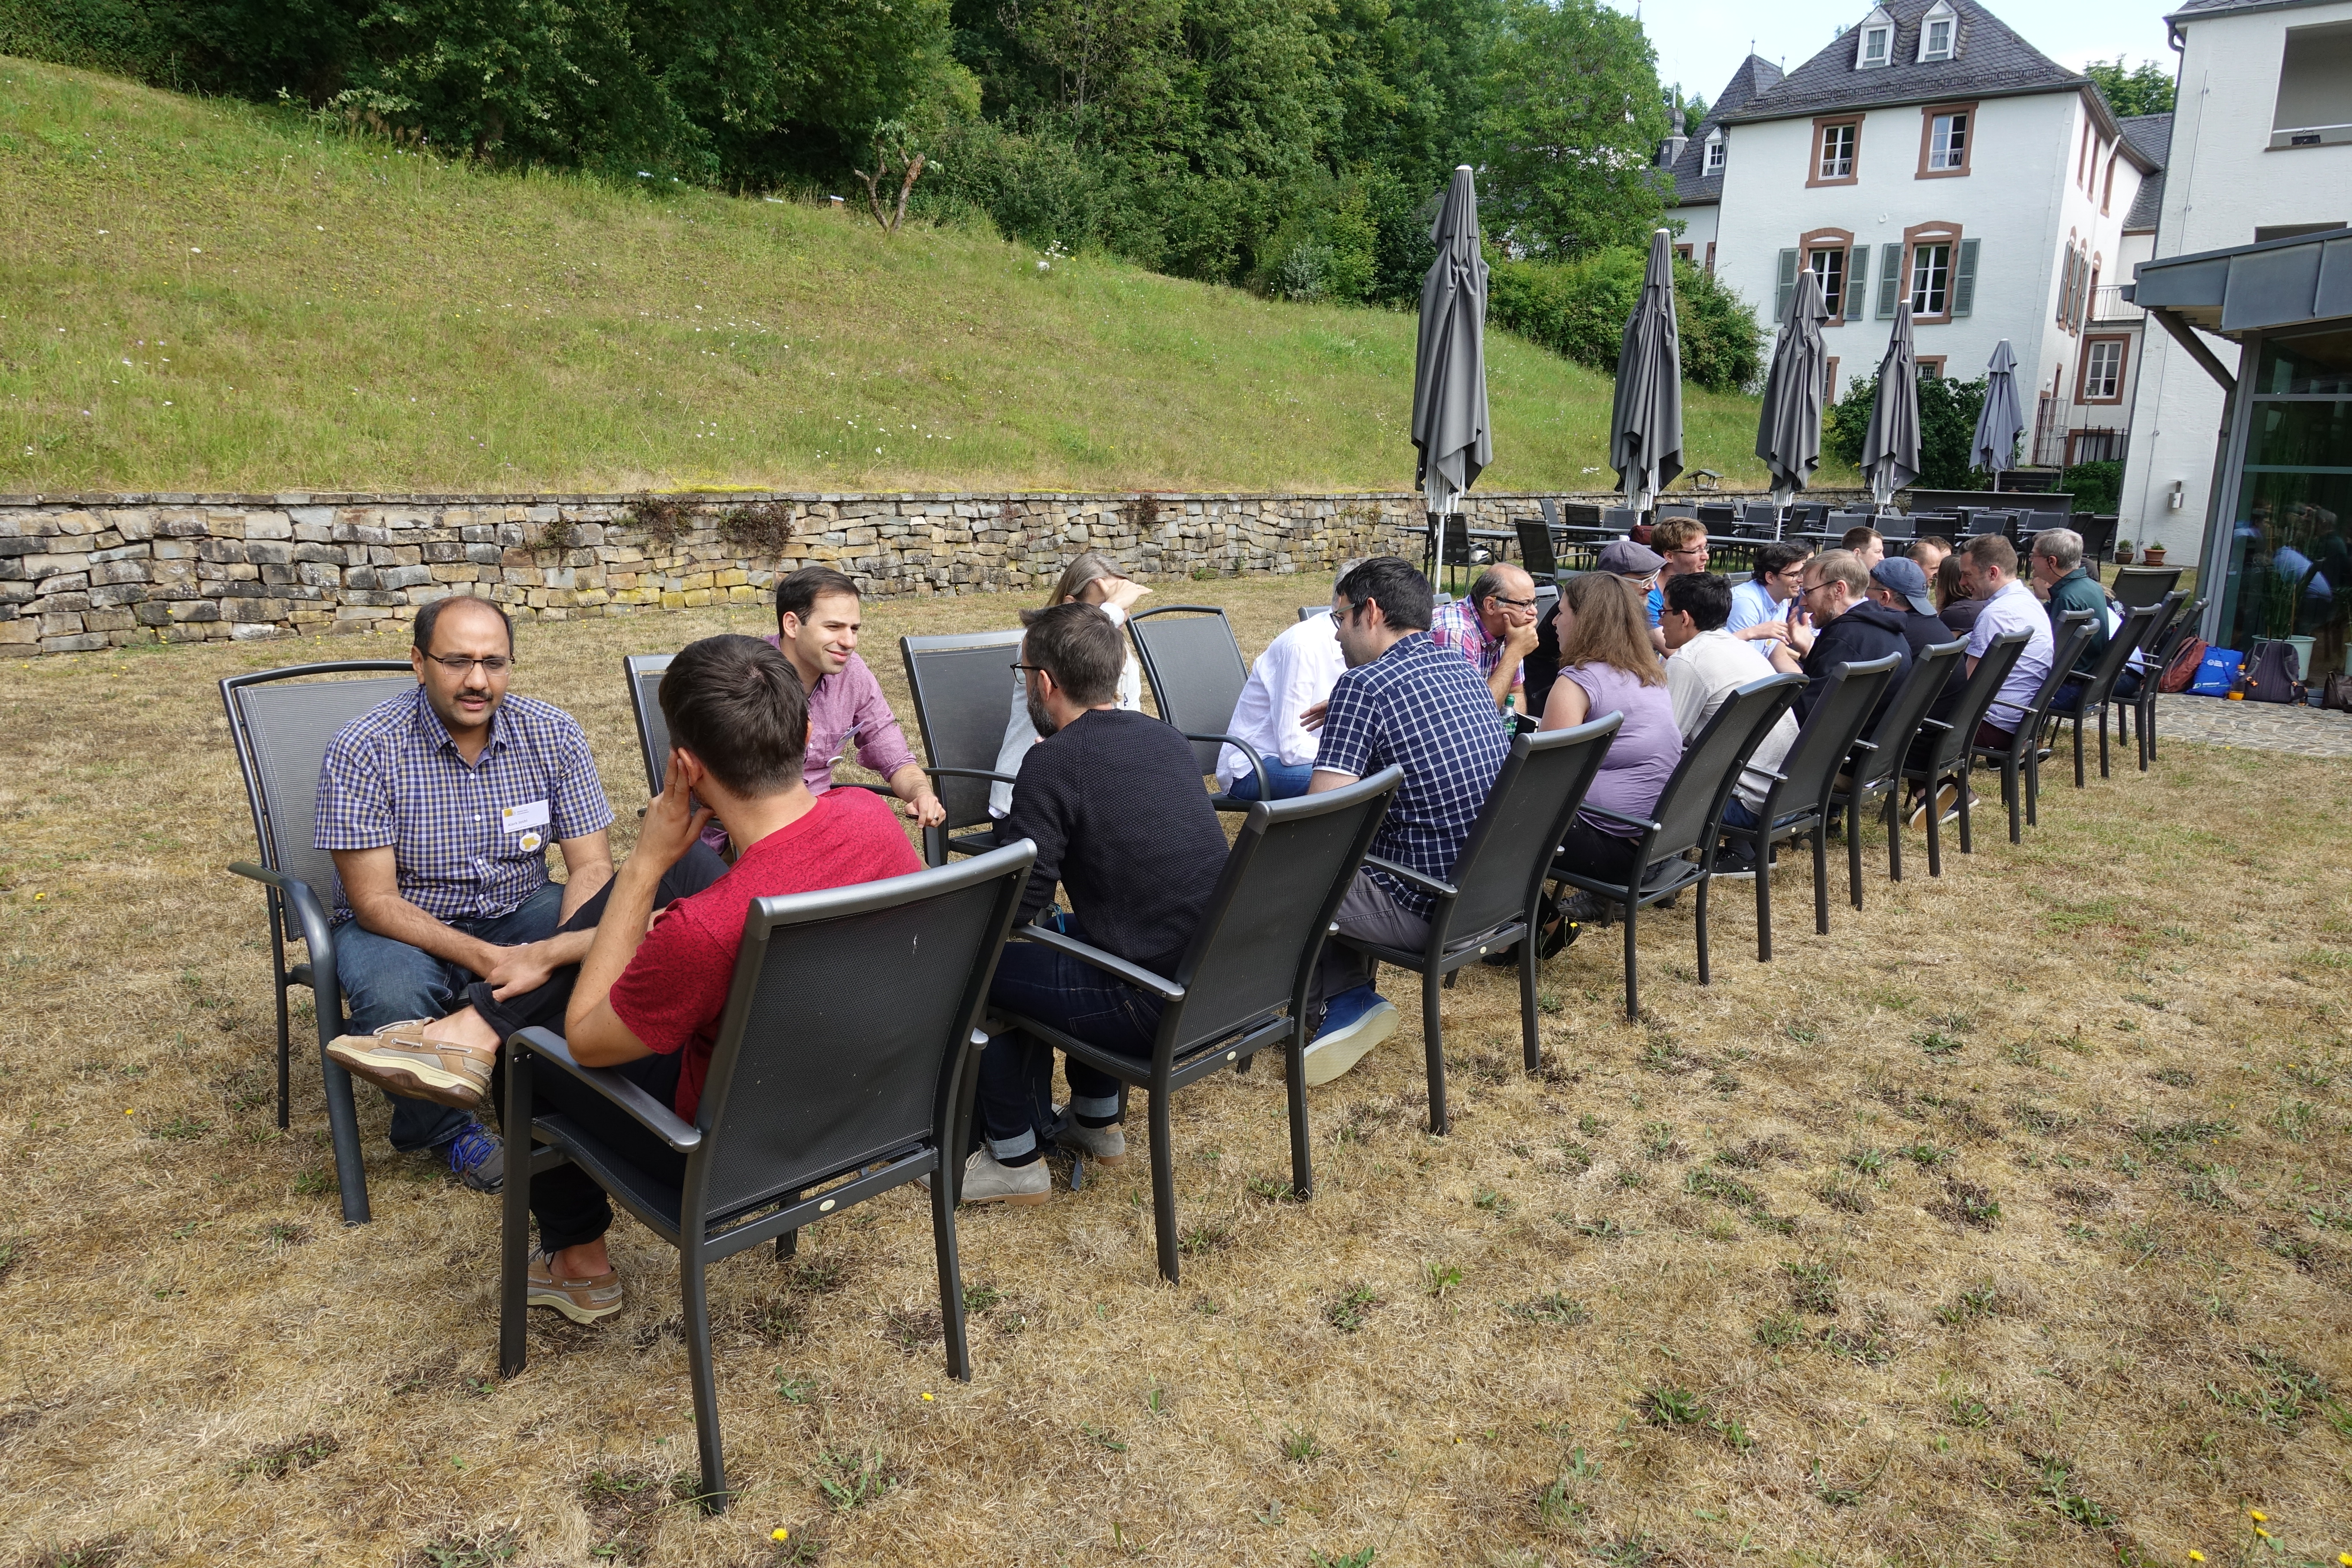
Monday. The seminar was kicked off by the organizers with an introduction to the topic of mobile data visualization and by providing organizational information. Afterwards, all participants introduced themselves and their expectations with a short two-minute slide presentation. This session was followed by a speedy research brainstorming activity (see Figure 2): In rapid five-minute sessions, two participants facing each other introduced their research activities and jointly sketched new ideas. By rotating half of the group, each session was repeated eleven times with new constellations of two people each time.
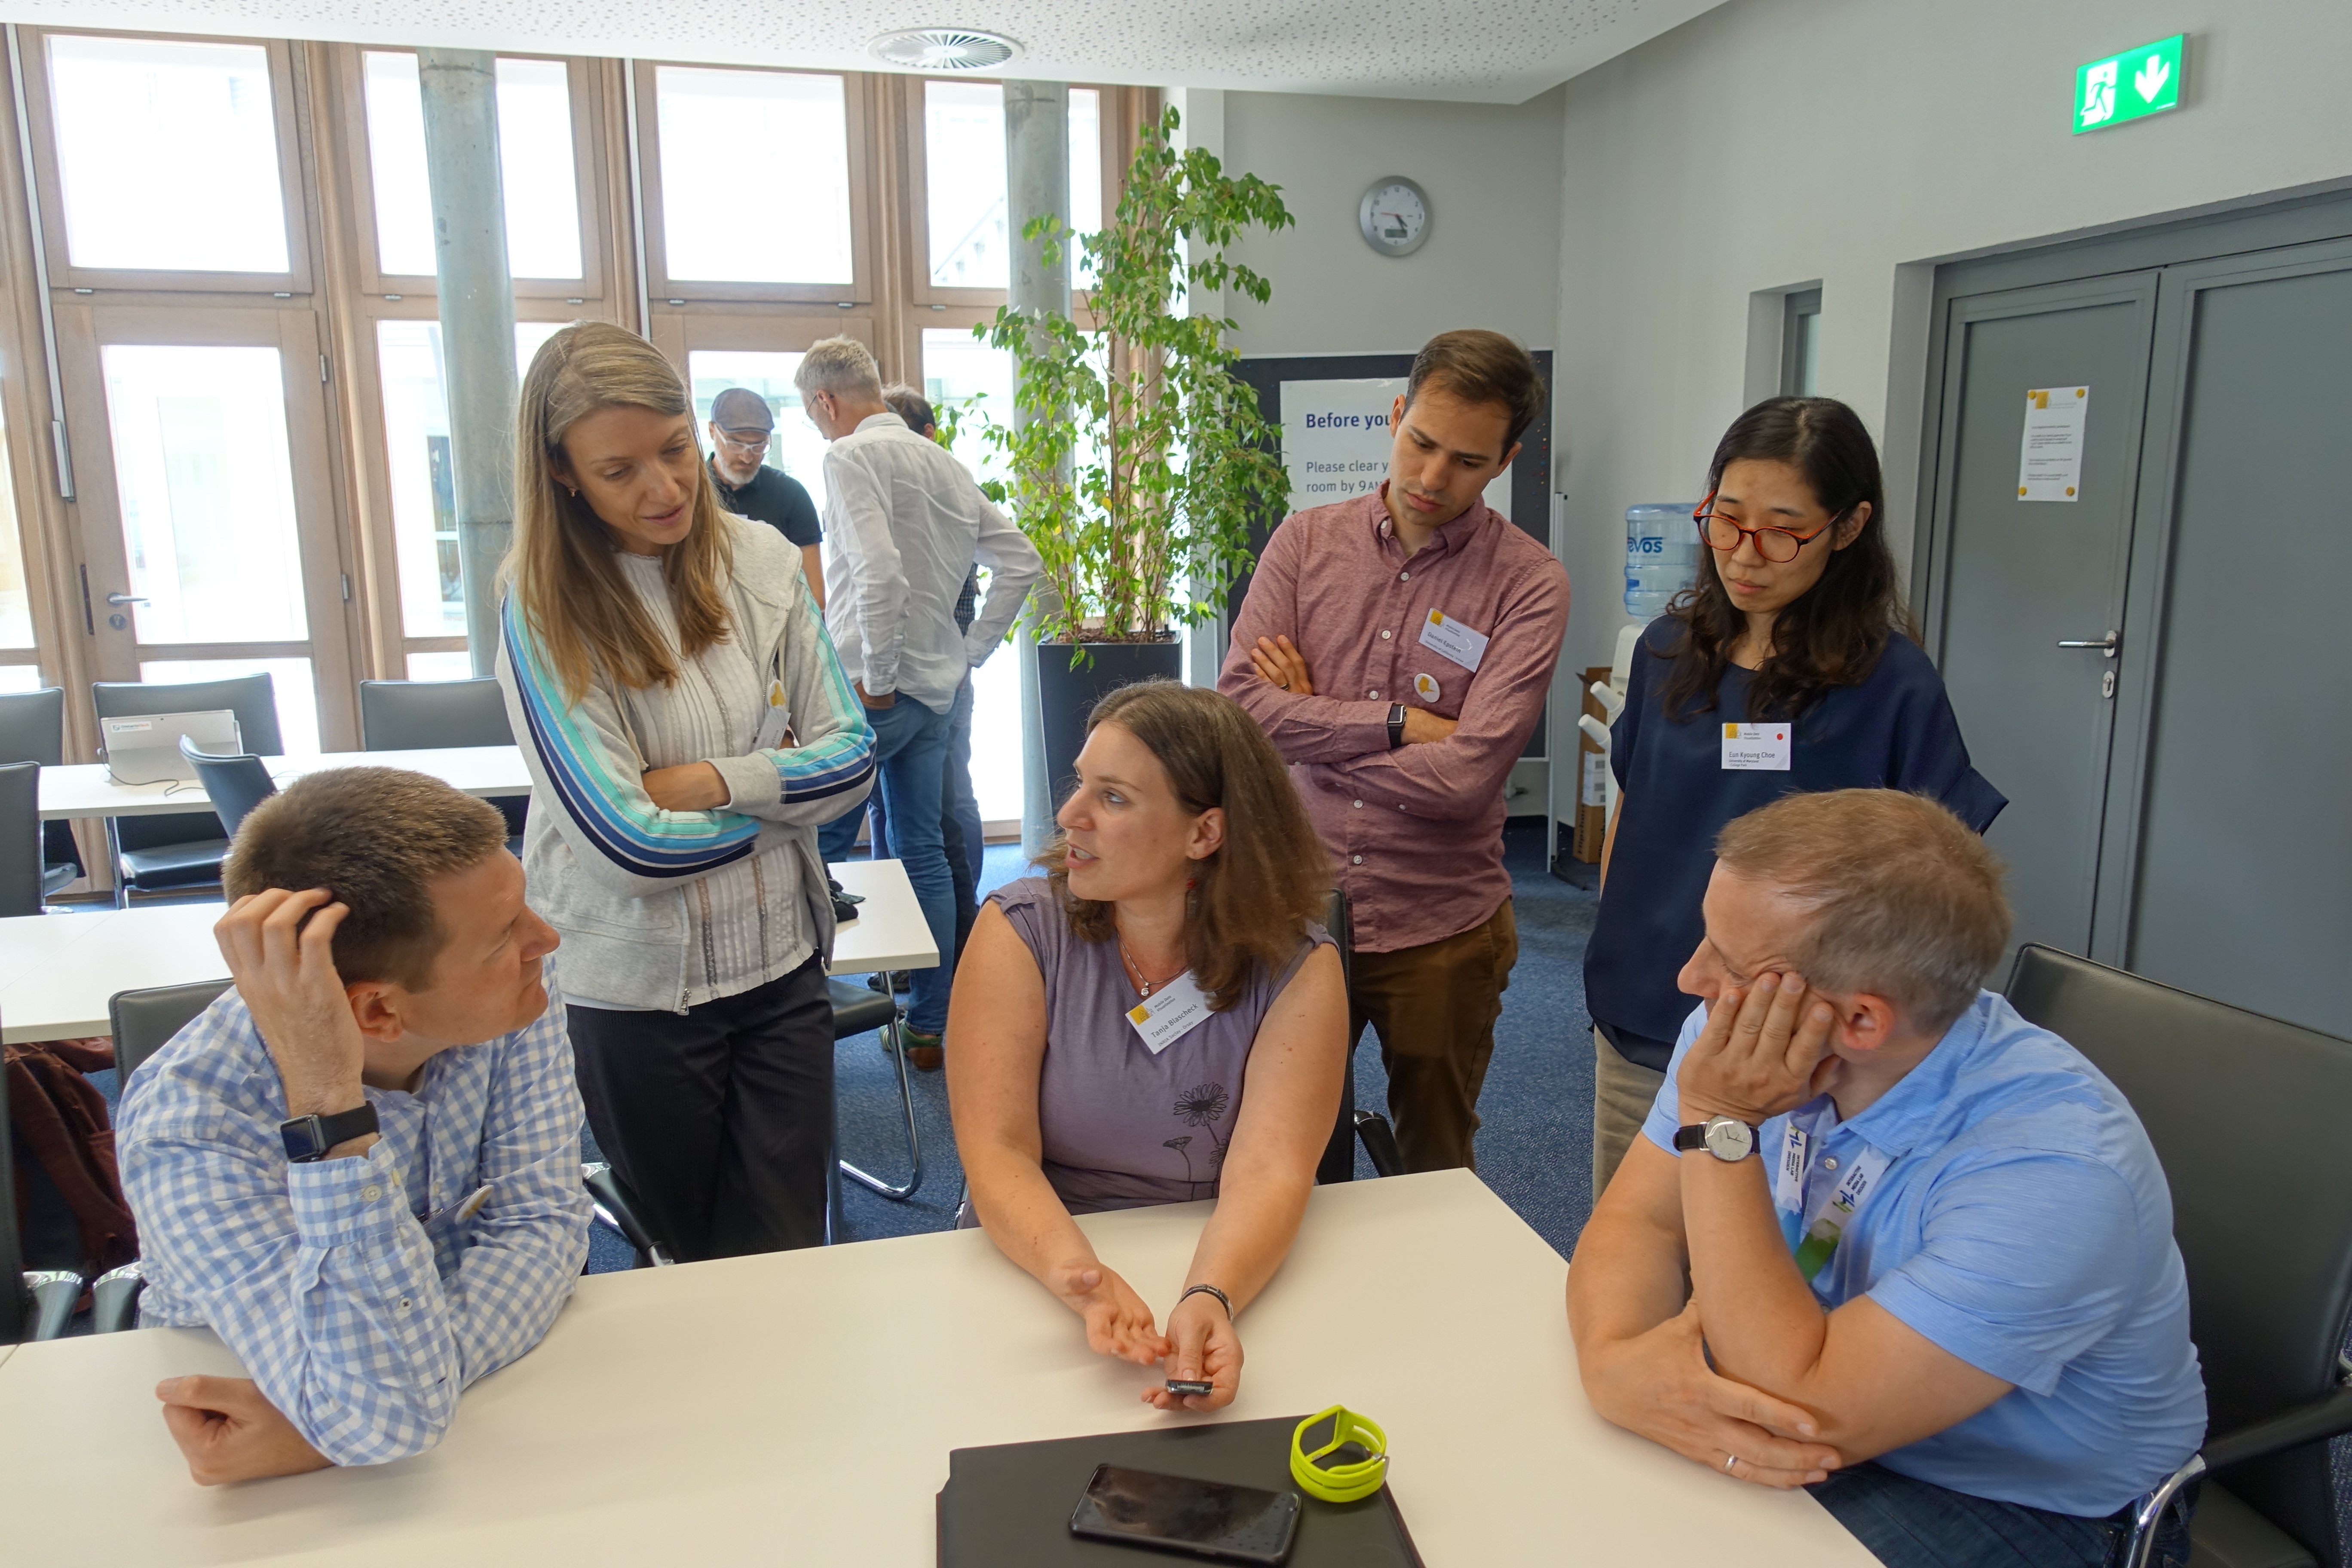
In the afternoon, five demo stations were set up and participants were split into groups to attend them in turn. Five researchers presented their latest mobile visualization demos in hands-on sessions (see Figure). These were:
- Tanja Blascheck: Smartwatch demo from a study comparing three representations--bar, donut, text (joint work with Lonni Besançon, Anastasia Bezerianos, Bongshin Lee, Petra Isenberg).
- Matthew Bremer: Tilting, brushing, & dialing for mobile vis (joint work with Bongshin Lee, Christopher Collins, Ken Hinckley).
- Tobias Isenberg: Personal home automation system with mobile data access and control.
- Alark Joshi: Visualization of off-screen data using summarization techniques (joint work with Martino Kuan, Alejandro Garcia, Sophie Engle).
- Jo Vermeulen: Product Fingerprints, a mobile visualization that allows people to compare nutritional information between food products (joint work with Carrie Mah, Kevin Ta, Samuel Huron, Richard Pusch, Jo Vermeulen, Lora Oehlberg, Sheelagh Carpendale).
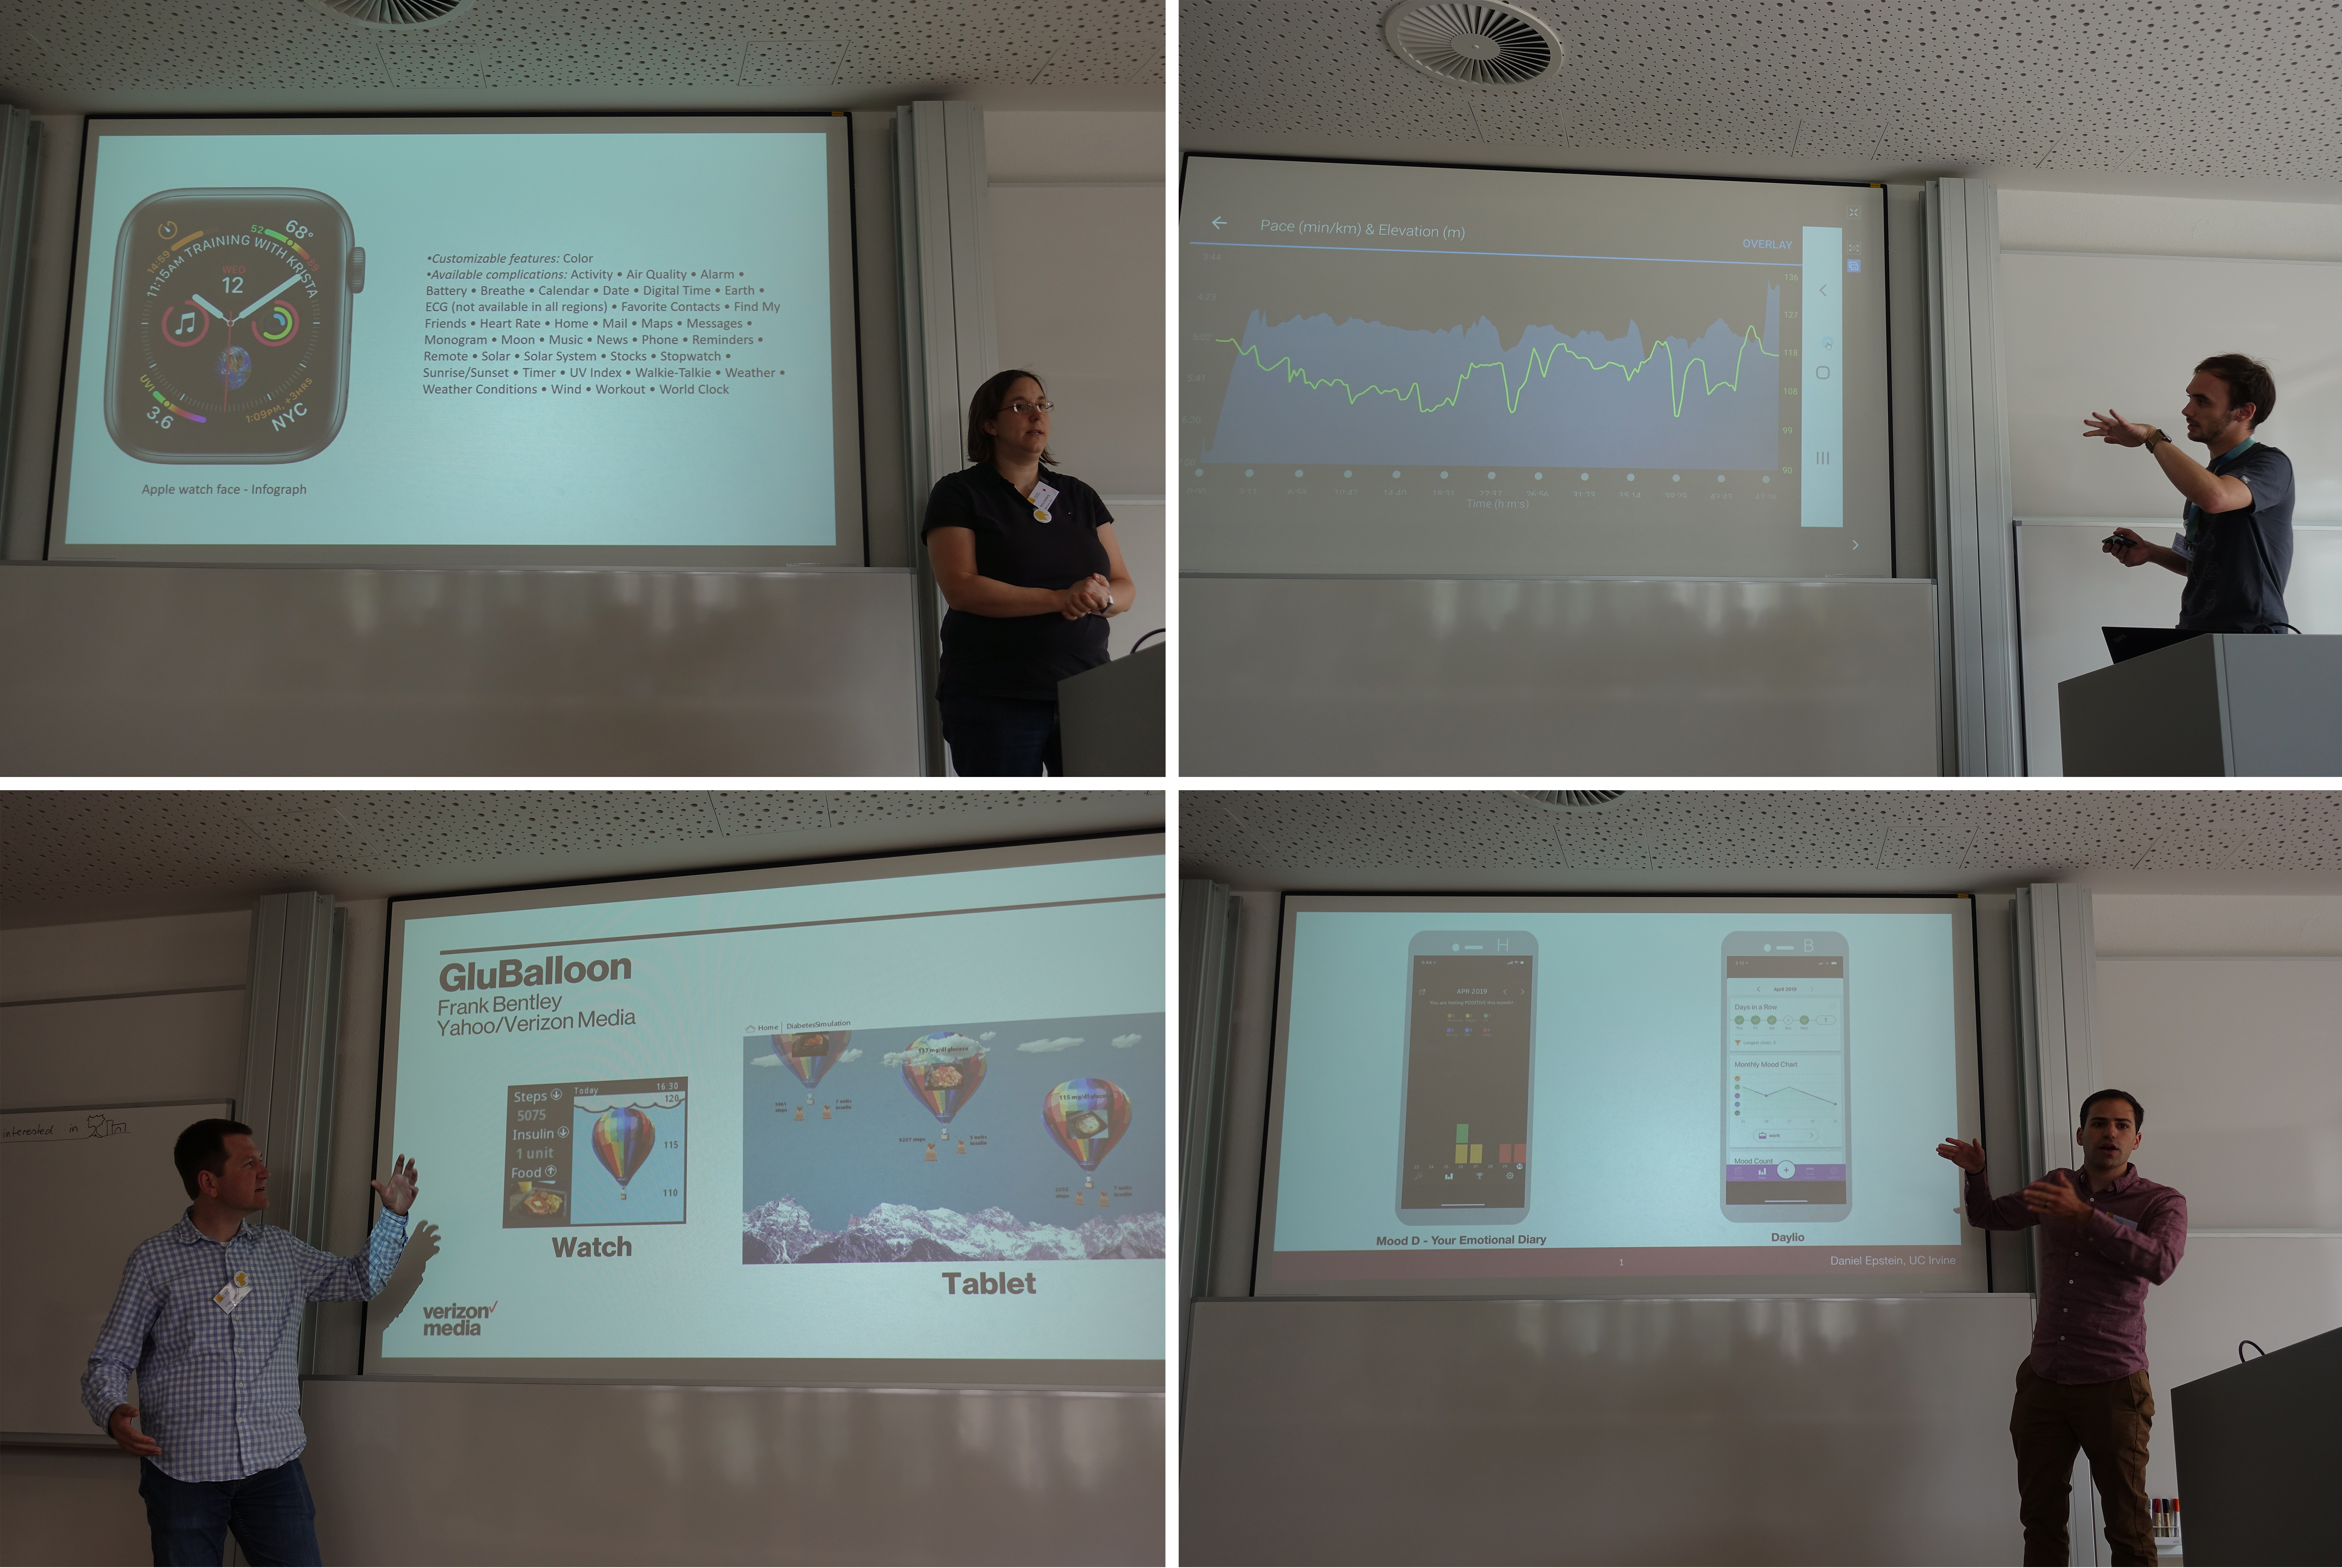
In a second activity, 14 participants presented a design critique of an existing mobile visualization, partly commercial products, partly research results (see Figure 4). Besides evoking the spirit of a good discussion, it helped getting a broad overview about currently available solutions.
In a followup activity, to arrive at a common understanding of the state of the art in mobile data visualization, we split attendees into three groups according to their main expertise. The three groups were:
- Information Visualization--Mobile Visualization Resources
- Visualization in Ubiquitous Computing Research
- Mobile Interaction and Human Computer Interaction
Each group was tasked to collect and discuss the state of the art, with an end goal of creating a short presentation to be given to the entire audience. As a result, the collected material and insights were presented to the plenum by each group.
Through these diverse activities during the first day, participants did not only gain a good understanding of each other's background and research interests, but also established a common ground and expertise in the field of mobile data visualization
Tuesday. The second day started with a lively brainstorming and discussion of challenges and important research questions in the field of mobile data visualization. From about ten larger topics we identified, four were chosen to form parallel breakout groups:
- Group 1: Evaluating Mobile Data Visualization
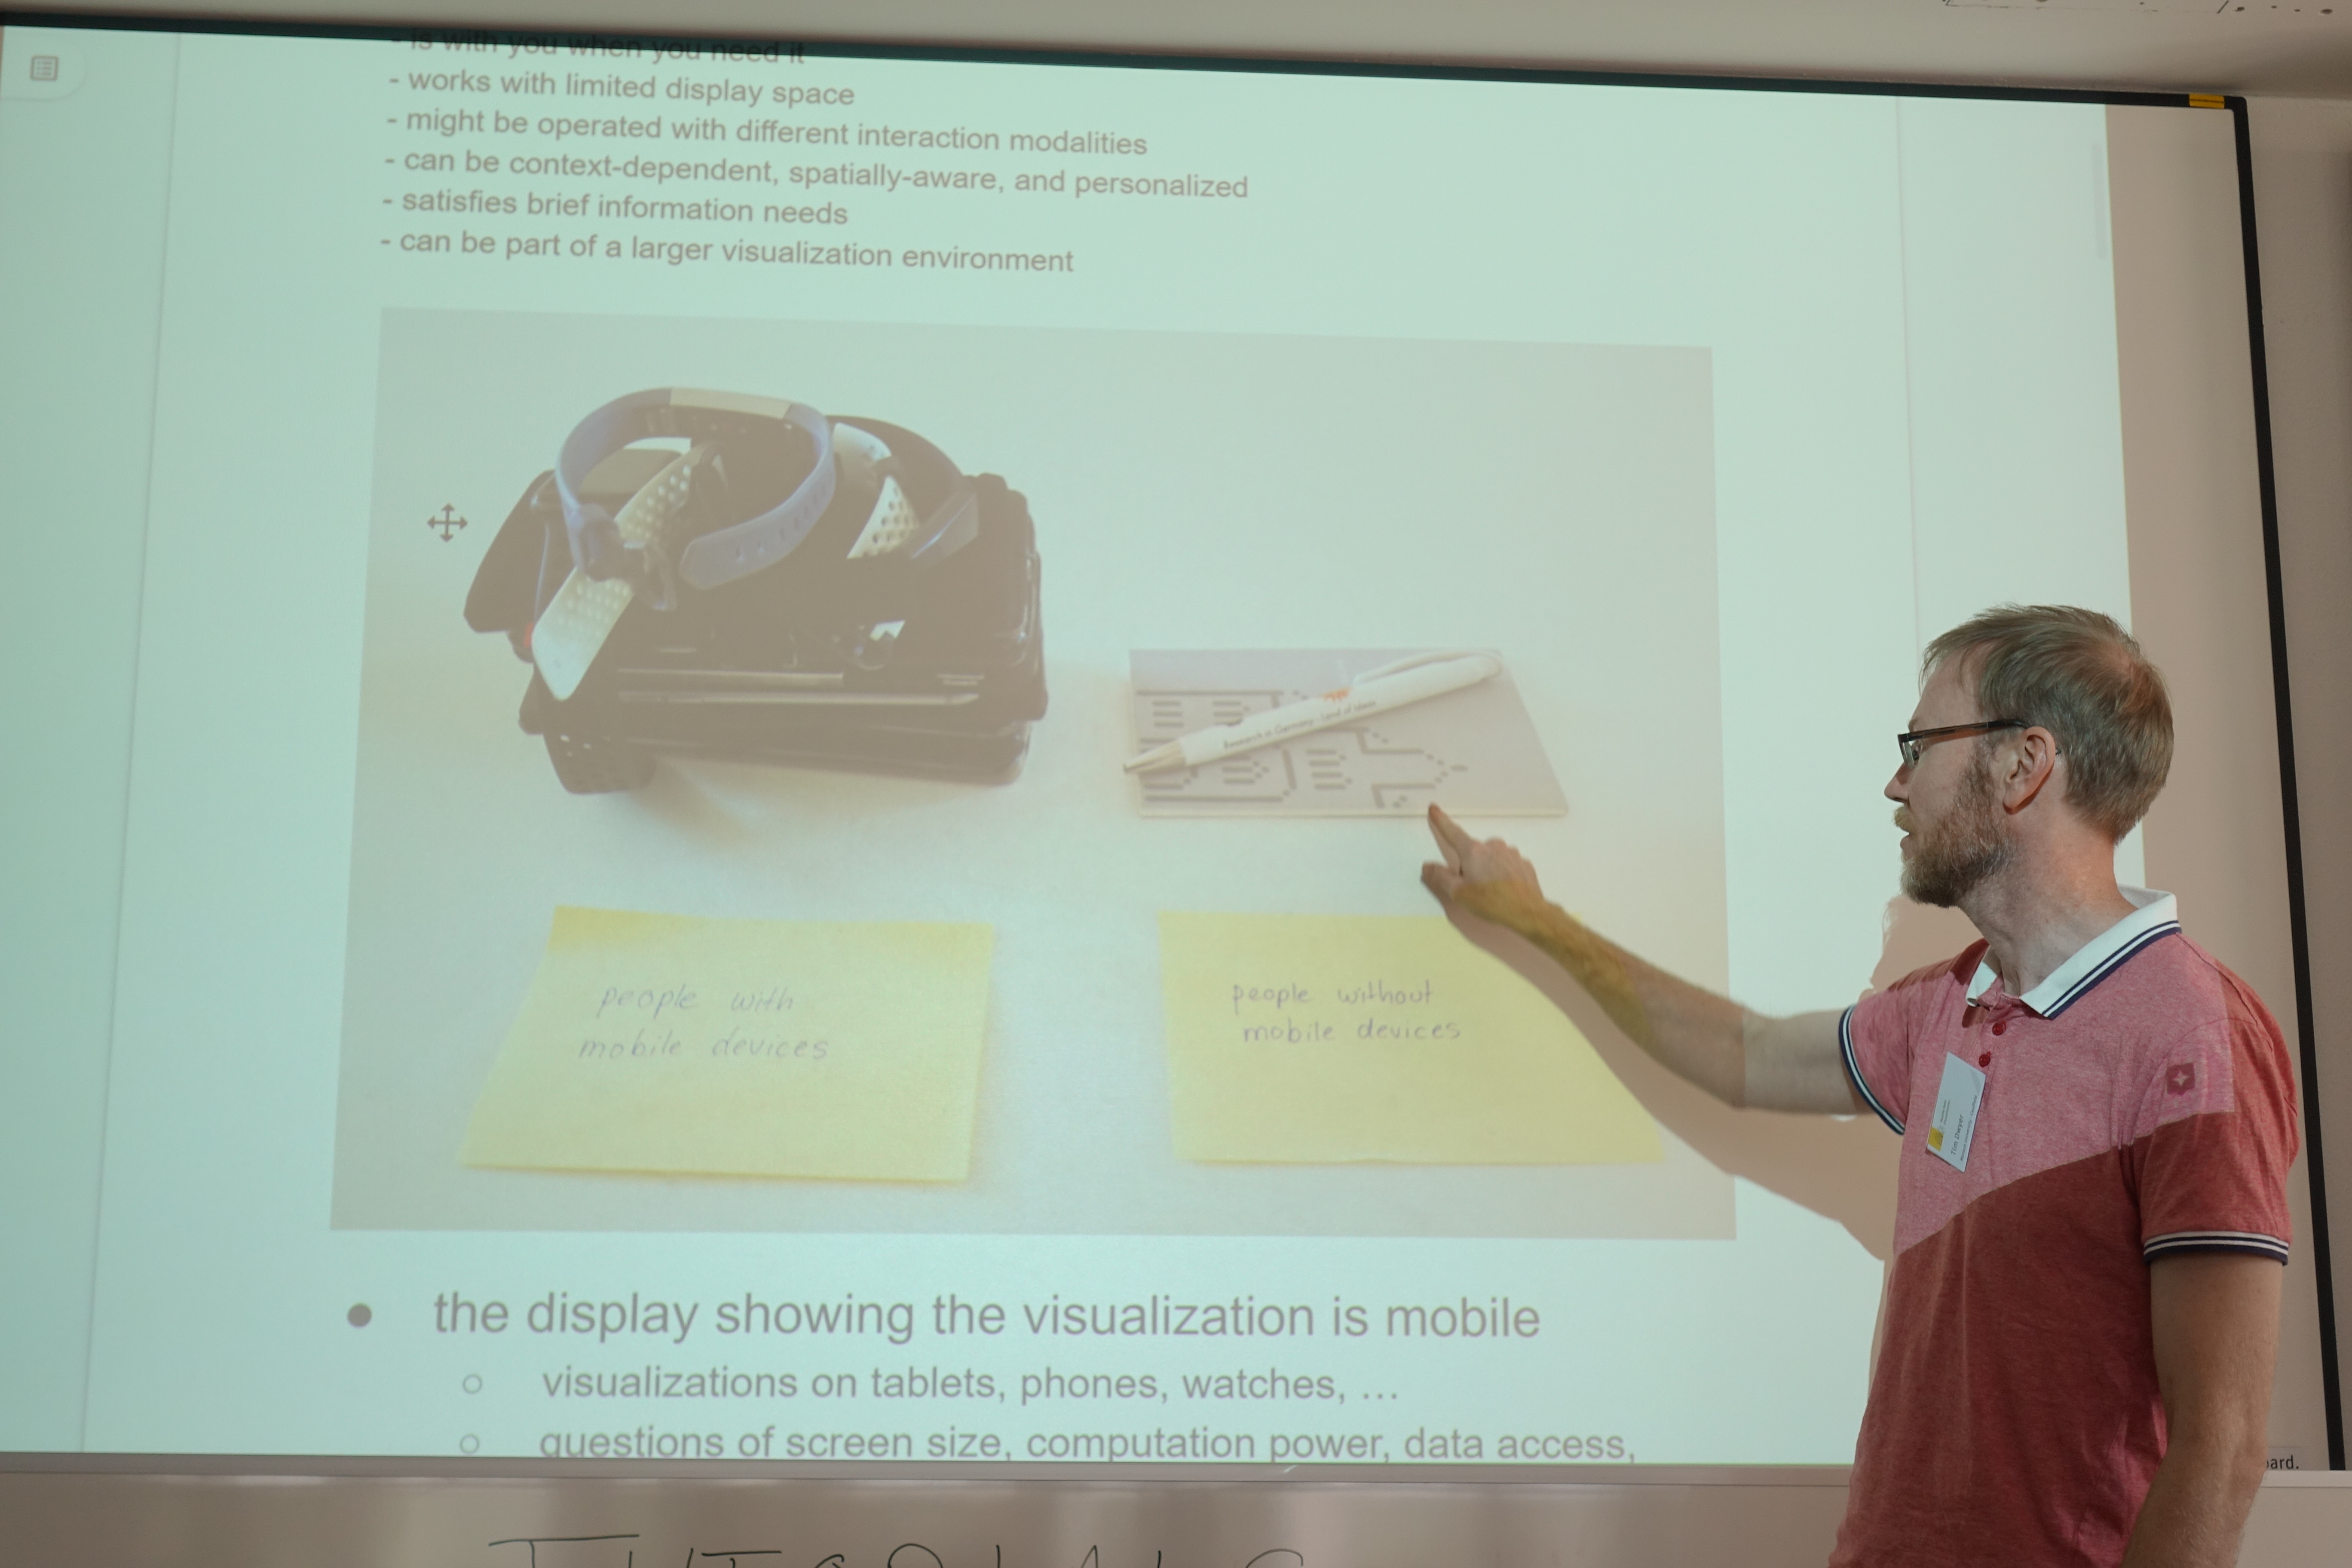
- Group 2: What is Mobile Vis?
- Group 3: Responsive Visualization
- Group 4: Vis for Good & Ethics
Using the impressive facilities of Dagstuhl in terms of rooms and places, space to think and coffee to drink, we had intense discussions within each group. We generated deeper research questions and challenges, and identified collaborative cross-disciplinary research opportunities and approaches. Section 4 provides more details on each of these working groups.
After lunch, groups reported back on what they had discussed (see Figure 5). The four groups decided to continue and deepen their discussions in the afternoon, this time focusing more on what could become a concrete research output.
Wednesday. Wednesday morning was devoted to the presentation of tutorials. Five participants had volunteered to give tutorials in two time slots, allowing other participants to attend two one-hour tutorials. Figure 6 shows the title slides of all informative and well-received tutorials, and Section 3 provides details on each of them.
Following the tradition of Dagstuhl Seminar, Wednesday afternoon was set aside for social activities. We took the bus to experience the famous Saarschleife high from the impressive treetop walk. Visiting Mettlach and having dinner in a brewery intensified personal conversations and fostered planning for joint research collaborations.
Thursday. Similar to Tuesday, the entire day was dedicated to group work (see Figure 7). The list of possible topics for breakout groups was revisited, and people assembled to form new groups on other challenging topics:
- Group 5: Starting Mobile Visualization from Scratch
- Group 6: Beyond Watch & Phone: From Mobile to Ubiquitous Visualization
- Group 7: (Discoverable) Interaction for Mobile Visualization
- Group 8: From Perception to Behavior Change: Designing and Evaluating Glanceable Mobile Vis
- Group 9: Mobile Vis for 3D Data / AR Vis
Again, both the morning and afternoon were used for intensely discussing challenges, defining design spaces, shaping the knowledge on the given topic, and identifying opportunities for joint research. Groups also reported back to the plenum, and results were discussed openly. Section 4 provides more details on each of these working groups and their outcomes.
Friday. After interesting and enriching days of joint discussions, which considerably broadened the horizon, time had come to wrap up the seminar on Mobile Data Visualization. Most importantly, a broad range of future collaborative activities were discussed: writing a state-of-the-art report, joint grant proposals, further workshop proposals, individual papers, editing a special journal issue, and writing a book on the topic. In the end, we agreed on a book as a possible major outcome (see Section 5). Organizational details were clarified, before the seminar was concluded with thanking all participants for their great contributions and commitment during the entire week.
Eun Kyoung Choe, Raimund Dachselt, Petra Isenberg, and Bongshin Lee
- Wolfgang Aigner (FH St. Pölten, AT) [dblp]
- Dominikus Baur (Volkswagen Data:Lab - München, DE) [dblp]
- Frank Bentley (Yahoo Labs - Sunnyvale, US) [dblp]
- Lonni Besancon (Linköping University, SE) [dblp]
- Tanja Blascheck (Universität Stuttgart, DE) [dblp]
- Matthew Brehmer (Vancouver, CA) [dblp]
- Sheelagh Carpendale (Simon Fraser University - Burnaby, CA) [dblp]
- Eun Kyoung Choe (University of Maryland - College Park, US) [dblp]
- Christopher Collins (Ontario Tech - Oshawa, CA) [dblp]
- Raimund Dachselt (TU Dresden, DE) [dblp]
- Tim Dwyer (Monash University - Caulfield, AU) [dblp]
- Daniel Epstein (University of California - Irvine, US) [dblp]
- Tom Horak (TU Dresden, DE) [dblp]
- Pourang P. Irani (University of Manitoba - Winnipeg, CA) [dblp]
- Petra Isenberg (INRIA Saclay - Orsay, FR) [dblp]
- Tobias Isenberg (INRIA Saclay - Orsay, FR) [dblp]
- Alark Joshi (University of San Francisco, US) [dblp]
- Ricardo Langner (TU Dresden, DE) [dblp]
- Bongshin Lee (Microsoft Research - Redmond, US) [dblp]
- Lena Mamykina (Columbia University - New York, US) [dblp]
- Charles Perin (University of Victoria, CA) [dblp]
- Harald Reiterer (Universität Konstanz, DE) [dblp]
- John T. Stasko (Georgia Institute of Technology - Atlanta, US) [dblp]
- Christian Tominski (Universität Rostock, DE) [dblp]
- Jo Vermeulen (Aarhus University, DK) [dblp]
Classification
- mobile computing
- society / human-computer interaction
Keywords
- Mobile Computing
- Data Visualization
- Information Visualization
- Ubiquitous Computing
- Human-Computer Interaction