Dagstuhl Seminar 18482
Network Visualization in the Humanities
( Nov 25 – Nov 30, 2018 )
Permalink
Organizers
- Katy Börner (Indiana University - Bloomington, US)
- Oyvind Eide (Universität Köln, DE)
- Tamara Mchedlidze (KIT - Karlsruher Institut für Technologie, DE)
- Malte Rehbein (Universität Passau, DE)
- Gerik Scheuermann (Universität Leipzig, DE)
Contact
- Andreas Dolzmann (for scientific matters)
- Simone Schilke (for administrative matters)
Digital humanities have seen fast growth in the last ten years. Digital humanities scholars of all fields extract data from their object of study and apply computational methods to answer research questions and to gain new insights. Much of the data collected from, e.g., books, historical texts, publications, dialogs, speeches, archaeological databases, and art pieces can be modeled as networks. Existing network analysis and visualization techniques have already proven themselves useful in analyzing these data and providing new discoveries.
The central goal of the network visualization field is the development of techniques and algorithms for effective network visualization. While network visualization strongly impacts a variety of different major research areas (incl. social science, bioinformatics, neuroscience, electronics, software engineering, business informatics, etc.), the humanities fields use only a tiny portion of the existing network visualization methods. On the other hand, network visualization scholars have not made an extensive attempt to develop and adapt techniques to be used by humanities researchers. Besides the general force-directed algorithm, there is a very limited number of other types of network visualization techniques that have been successfully applied in the humanities. This is partially due to the fact that existing network visualization tools fail to provide support to the humanities scholars, for a number of reasons:
- They are designed for very different kinds of data sets to those typically occurring in the humanities, which are often incomplete and come from various sources; i.e., the traditional social network analysis metrics, based on which visualizations are often constructed, are of little value.
- Typical network visualization techniques are designed to work on a scale too coarse to be used to display humanities data. In particular, questions in humanities are typically more granular than in most social sciences, and therefore require analyses finer than those currently afforded by most visualization software.
- Humanities scholars often “think through data.” In other words, they need a visualization that is interactive, and not only for exploring results. Current visualization tools provide limited possibilities for interactivity. Moreover, interaction requirements heavily depend on the application and use case.
- Visualization requirements in humanities fields are very specific and can be formulated by only considering particular applications and use cases. Such specific requirements are rarely taken into consideration by visualization tools. However, recent practice has shown that adaptations of existing visualization methods may prove themselves very valuable for humanities scholars.
In order to promote the development of newly tailored and effective visualization solutions as well as in order to support the adaptation of already existing visualization techniques and their integration into humanities scholars’ research routine, this Dagstuhl Seminar will bring together researchers from network visualization and digital humanities communities for the first time. Through several stimulating talks and brainstorming sessions the researchers will inform each other about current challenges in network visualization in the humanities and about existing visualization methods. Afterwards, working in smaller groups, the researchers will aim for a research agenda for network visualization challenges in the humanities.
The main goals of the seminar are:
- Information diffusion: network visualization experts will inform about existing methods and algorithmic techniques for network visualization; humanities scholars will inform about data sources, application backgrounds, questions, potential use cases, etc. in the humanities.
- A research agenda for “Network Visualization in Digital Humanities” listing applications, corresponding data and data sources, use cases, visualization and interaction requirements, possible existing visualization solutions, new visualization challenges, and necessary adaptations.
- The creation of interdisciplinary research teams that address specific scientific challenges from the agenda as well as the stimulation of collaborations and research projects.
 Katy Börner, Dan Edelstein, Tamara Mchedlidze, Gerik Scheuermann, and Raymond G. Siemens
Seminar Goals
The application of computer-based methods by scholars of the Humanities has a tradition that goes back to the mid 20th century. Labelled “Digital Humanities” some 15 years ago, it has seen a significant growth since then [1]. An important part of Digital Humanities methodology is to establish data sets [2] based on cultural artefacts such as fiction texts, paintings, musical scores and recordings, and historical sources in all media. This is done in a number of different ways and includes some sort of extraction of data from sources computer assisted analysis and visualization. When this process works well, it supports scholars’ endeavours to answer existing research questions and to generate new insights and novel research questions. A significant part of the data collected can be modeled as networks.
Existing network analysis and visualization techniques have already proven themselves immensely useful in analyzing Digital Humanities data and providing new discoveries [3]. The central goal of research on network visualization for digital humanities scholars is to develop visualization techniques and algorithms that empower scholars to use those effectively as part of their research process and for communicating study results to readers. While network science approaches are widely used in other research areas, the power of a network mindset and approach has not yet been fully exploited within the Humanities.
The seminar aimed to enhance the development of network visualization algorithms and tools centered around humanities research. In particular, its goals were as follows:
- Interdisciplinary Exchange: to discuss existing network visualization methods and algorithms in perspective of their potential application within the Humanities;
- Terminology Gap: Bridging the gap in terminology between Digital Humanities on one side and computer scientists in Network Visualization and Graph Drawing on the other side;
- Data: to discuss Humanities’ data sources and their nature, research questions, use cases, and specific application profiles in perspective of their potential support by network visualisation.
- Reserch Agenda: Formulation of research agenda on “Network Visualization in the Digital Humanities”. Creation of interdisciplinary teams of researchers that address specific scientific challenges of the agenda;
Seminar Program
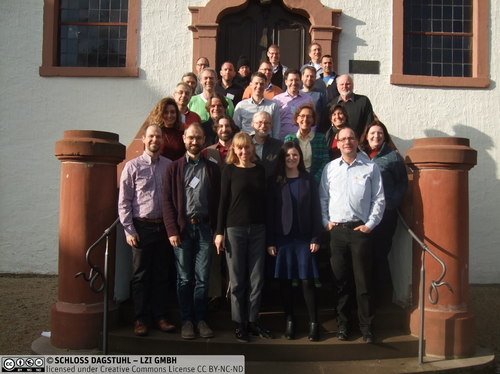
The seminar brought together 27 researchers from Network Visualization and Digital Humanities communities. The initial two days of the weeklong event were devoted to bring together the different communities and to develop a mutual understanding. Researchers informed each other about their scholarly background through short, five-minute talks. In addition, there were eight long, 45 minutes, presentations in which digital humanities scholars discussed network and network visualization challenges and opportunities in their field of expertise. This was complemented by surveys on network visualization and successful examples of cooperation between visualization and digital humanities researchers.
During both days the participants were asked to post questions and issues they would like to discuss in the remaining three days of the seminar. After a voting, four research areas most interesting the participant were identified. All four met the guiding principles in that they describe both: highly relevant applications within the Humanities as well as innovative research challenges for Network Visualisation. They are as follows:
- Complex networks, in particular multivariate, multilayered, and multilevel networks;
- Linked networks;
- Temporal networks;
- Uncertainty, incompleteness, and ambiguity of data.
Four groups were formed to work on those four topics over the remaining three days. There were several opportunities for joint discussions and progress reports across the groups. Summaries of the group discussions can be found in Section 4.
Future Plans
During the seminar the participants decided to proceed with a publication of a manifesto, outlining a research agenda for “network visualisation in the Humanities”. It was also planned to publish an edited volume on specific aspects of the overarching topic, possibly along the four major research areas identified by the seminar. The volume will be submitted as a special issue to “Historical Network Research”, an Open Access Journal.
Evaluation
The feedback provided by the participants in form of a survey collected by Schloss Dagstuhl was highly positive and in most aspects above the average collected over the last 60 seminars. The participants agreed that the seminar inspired new ideas, collaborations, joint publications and brought insight from neighboring fields. There was a number of positive comments by the participants on the structure and organization of the seminar as well as several useful suggestions for the future seminars.
Acknowledgement
As an organizing committee of the seminar we would like to thank the scientific and administration staff of Schloss Dagstuhl for the excellent support they provided, both in the preparation phase and during the seminar. On behalf of all participants, we would also like to thank Dagstuhl for the high quality facilities provided, for excellent rooms for work and socializing, for the tasty meals, and of course also for the excellent wine cellar. The organizers of the seminar would also like to thank Ray Siemens and Dan Edelstein for their contributions to the initial Dagstuhl proposal. Finally, we thank Christina Gillmann for taking the responsibility for this report.
References
- Kohle und Malte Rehbein (Hg.): Digital Humanities. Eine Einführung. Stuttgart, J.B. Metzler Verlag, S. 3–12.
- Schöch, Christof (2013) Big? Smart? Clean? Messy? Data in the Humanities. In: Journal of Digital Humanities 2 (3).
- Rehbein, Malte (forthcoming) Historical Network Research, Digital History, and Digital Humanities. In: Marten Düring, Florian Kerschbaumer, Linda von Keyserlingk und Martin Stark (Hg.): The Power of Networks. Prospects of Historical Network Research, Routledge.
 Katy Börner, Oyvind Eide, Tamara Mchedlidze, Malte Rehbein, and Gerik Scheuermann
- Gregor Betz (KIT - Karlsruher Institut für Technologie, DE) [dblp]
- Katy Börner (Indiana University - Bloomington, US) [dblp]
- Ulrik Brandes (ETH Zürich, CH) [dblp]
- Nicole Coleman (Stanford University, US) [dblp]
- Melanie Conroy (University of Memphis, US)
- Marten Düring (University of Luxembourg, LU) [dblp]
- Tim Dwyer (Monash University - Caulfield, AU) [dblp]
- Oyvind Eide (Universität Köln, DE) [dblp]
- Kimmo Elo (University of Turku, FI)
- Sara Irina Fabrikant (Universität Zürich, CH) [dblp]
- Christina Gillmann (TU Kaiserslautern, DE) [dblp]
- Hans Hagen (TU Kaiserslautern, DE) [dblp]
- Francis Harvey (Leibniz Institut für Länderkunde - Leipzig, DE) [dblp]
- Gerhard Heyer (Universität Leipzig, DE) [dblp]
- Stefan Jänicke (Universität Leipzig, DE) [dblp]
- Fotis Jannidis (Universität Würzburg, DE) [dblp]
- Andreas Kerren (Linnaeus University - Växjö, SE) [dblp]
- Stephen Kobourov (University of Arizona - Tucson, US) [dblp]
- Tamara Mchedlidze (KIT - Karlsruher Institut für Technologie, DE) [dblp]
- Martin Nöllenburg (TU Wien, AT) [dblp]
- Malte Rehbein (Universität Passau, DE) [dblp]
- Gerik Scheuermann (Universität Leipzig, DE) [dblp]
- Antonios Symvonis (National TU - Athens, GR) [dblp]
- Timothy Tangherlini (University of California at Los Angeles, US) [dblp]
- Christopher Warren (Carnegie Mellon University - Pittsburgh, US) [dblp]
- Scott Weingart (Carnegie Mellon University - Pittsburgh, US) [dblp]
- Florian Windhager (Donau-Universität Krems, AT) [dblp]
Classification
- computer graphics / computer vision
- data structures / algorithms / complexity
- networks
Keywords
- digital humanities
- network visualization
- graph drawing
- distant reading
- human computer interaction

 Creative Commons BY 3.0 DE
