Dagstuhl Seminar 18441
Data Physicalization
( Oct 28 – Nov 02, 2018 )
(Click in the middle of the image to enlarge)
Permalink
Please use the following short url to reference this page:
https://www.dagstuhl.de/18441
Organizers
- Jason Alexander (Lancaster University, GB)
- Petra Isenberg (INRIA Saclay - Orsay, FR)
- Yvonne Jansen (CNRS-Sorbonne University - Paris, FR)
- Bernice E. Rogowitz (Visual Perspectives - New York & Columbia University - New York, US)
- Andrew Vande Moere (KU Leuven, BE)
Contact
- Andreas Dolzmann (for scientific matters)
- Annette Beyer (for administrative matters)
Dagstuhl Seminar Wiki
- Dagstuhl Seminar Wiki (Use personal credentials as created in DOOR to log in)
Shared Documents
- Dagstuhl Materials Page (Use personal credentials as created in DOOR to log in)
Impacts
- An Emotional Response to the Value of Visualization : article - Wang, Yun; Segal, Adrien; Keefe, Daniel F.; Hurtienne, Jörn; Barrass, Stephen; Dwyer, Tim; Hornecker, Eva; Isenberg, Petra; Klatzky, Roberta L. - Los Alamitos : IEEE, 2019. - pp. 8-17 - (IEEE computer graphics ; 39. 2019, 5).
- Geometric problem solving with strings and pins : article - Freksa, Christian; Barkowsky, Thomas; Falomir, Zoe; Ven, Jasper van de - London : Taylor & Francis, 2019. - Pages 46-68 - (Spatial Cognition and Computation ; 19. 2019, 1).
- Making with Data : Physical Design and Craft in a Data-Driven World - Huron, Samuel; Nagel, Till; Oehlberg, Lora; Willett, Wesley - Wellesley : A K Peters, 2022.. ISBN: 978-1-03-218222-3 / 1-03-218222-9.
- Making with Data : Physical Design and Craft in a Data-Driven World - Huron, Samuel; Nagel, Till; Oehlberg, Lora; Willett, Wesley - Wellesley : A K Peters, 2023. - 392 S. - (A.K. Peters visualization series). ISBN: 978-1-03-218222-3.
- A Design Vocabulary for Data Physicalization : article : Just Accepted - Hornecker, Eva; Hogan, Trevor; Hinrichs, Uta; Koningsbruggen, Rosa van - New York : ACM, 2023. - 59 pp. - (ACM Transactions on Computer-Human Interaction ; 2023).
Data Physicalization is an emerging cross-disciplinary research area that examines how computer-supported, interactive physical representations of data can support communication, learning, problem solving, and decision-making with data. In contrast to traditional graphical data visualizations, data physicalizations encode data in a material form using 3D geometry and material properties. This seminar will be the first to bring together researchers and practitioners from a variety of disciplines such as computer science, design, education, art, and psychology. The seminar will help develop a common research agenda for Data Physicalization and spur collaborations across communities.
Scientists have long used physical representations to help them study complex problems. For example, Maxwell famously created physicalizations of 3D thermodynamic functions to reason about iso-pressure and iso-heat contours, while the double-helix structure of DNA was revealed to Watson and Crick through the construction of a manipulable, physical 3D model. In industry, General Electrics and Wellstar Health are using LEGO-based data physicalizations to analyze and communicate step-by-step progress on vehicle repairs and patient care. Data physicalizations have also been used by designers and artists as alternate methods for conveying meaningful, high impact insights in data, helping the public understand, e.g., variation in crime rates across a city, the impact of urban development on the environment, and tacit qualities of cultural heritage sites.
A lot has changed since early data physicalization practices, where static models provided limited support for experimentation and exploration of the data, and required considerable effort to create. Recent technological advances such as digital fabrication (e.g., 3D printing) now facilitate their creation, while shape-changing displays and advances in microactuators now enable dynamic data physicalizations for analytic, communicative or even decorative purposes.
Data Physicalization promises to complement traditional data visualizations in order to help people better reason about and learn from data, communicate it to others more effectively, and make better decisions. This emerging research area has the potential to enrich people's ability to discover, think and take action based on insights from data.
While many different communities are contributing to a growing body of work on questions important to Data Physicalization, these communities are disparate and largely disconnected. This seminar will provide the unique opportunity to develop synergies by fostering intellectual exchange on four general themes: (1) the design of perceptually and cognitively effective data physicalizations, (2) new interactive technologies and hardware platforms for data physicalization, (3) data physicalization in practice, for example, for data analysis, communication or education, (4) evaluation methodologies, for example, to compare physicalizations against traditional screen-based visualizations. The seminar's goals include:
- Developing a common terminology for discussing data physicalization, since many of the foundational concepts exist, by various names, in the various contributing disciplines.
- Identifying important gaps in our knowledge of haptic systems, interactive technologies, and perceptual/motor/cognitive mechanisms related to data physicalization.
- Identifying key application scenarios that will guide research and technology choices.
- Formulating a common research agenda that takes the interests and perspectives of the different communities into account.
 Creative Commons BY 3.0 DE
 Jason Alexander, Yvonne Jansen, Bernice E. Rogowitz, and Andrew Vande Moere
This executive summary gives a brief overview of the goals and agenda for our seminar.
Introduction
Among the earliest man-made artifacts are physical representations of semantic concepts. These "physicalizations" externalize numerical and abstract concepts, providing physical metaphors that allow us to reason, remember, and communicate. Physicalizations are created for many different purposes, or "intents." The sundial, for example, transforms shadows into a readable representation of time of day, the mercury thermometer transforms temperature into a displacement along a number line, and a scatterplot transforms the values of two variables into a form that allows the reader to interpret correlation. Our first data representations were based on natural objects, such as charcoal scraped onto walls or built from clay, or later, ink on paper. With the advent of computers, we've substituted physical representations with pixels on a computer screen. The resurgence of physicalization asks what we have lost in this transformation. Certainly, a computer-based visualization allows us to zoom an image, transform variables in real time, and to zoom through virtual computer-based world. However, these representations can sever the relationship to the natural world, depriving us of the touch, feel, and emotion that comes from interacting with real objects.
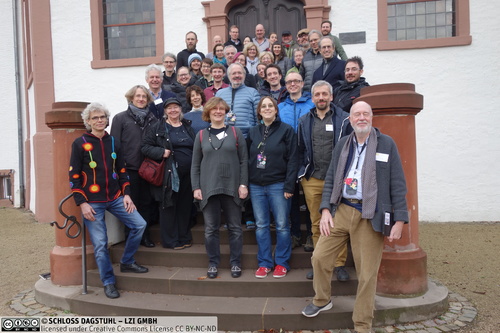
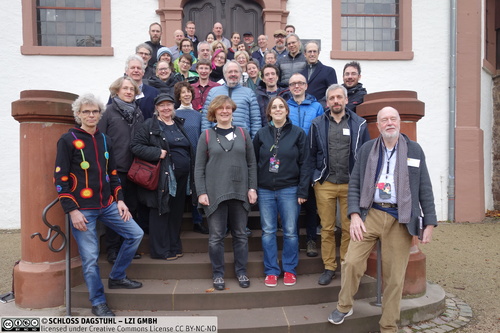
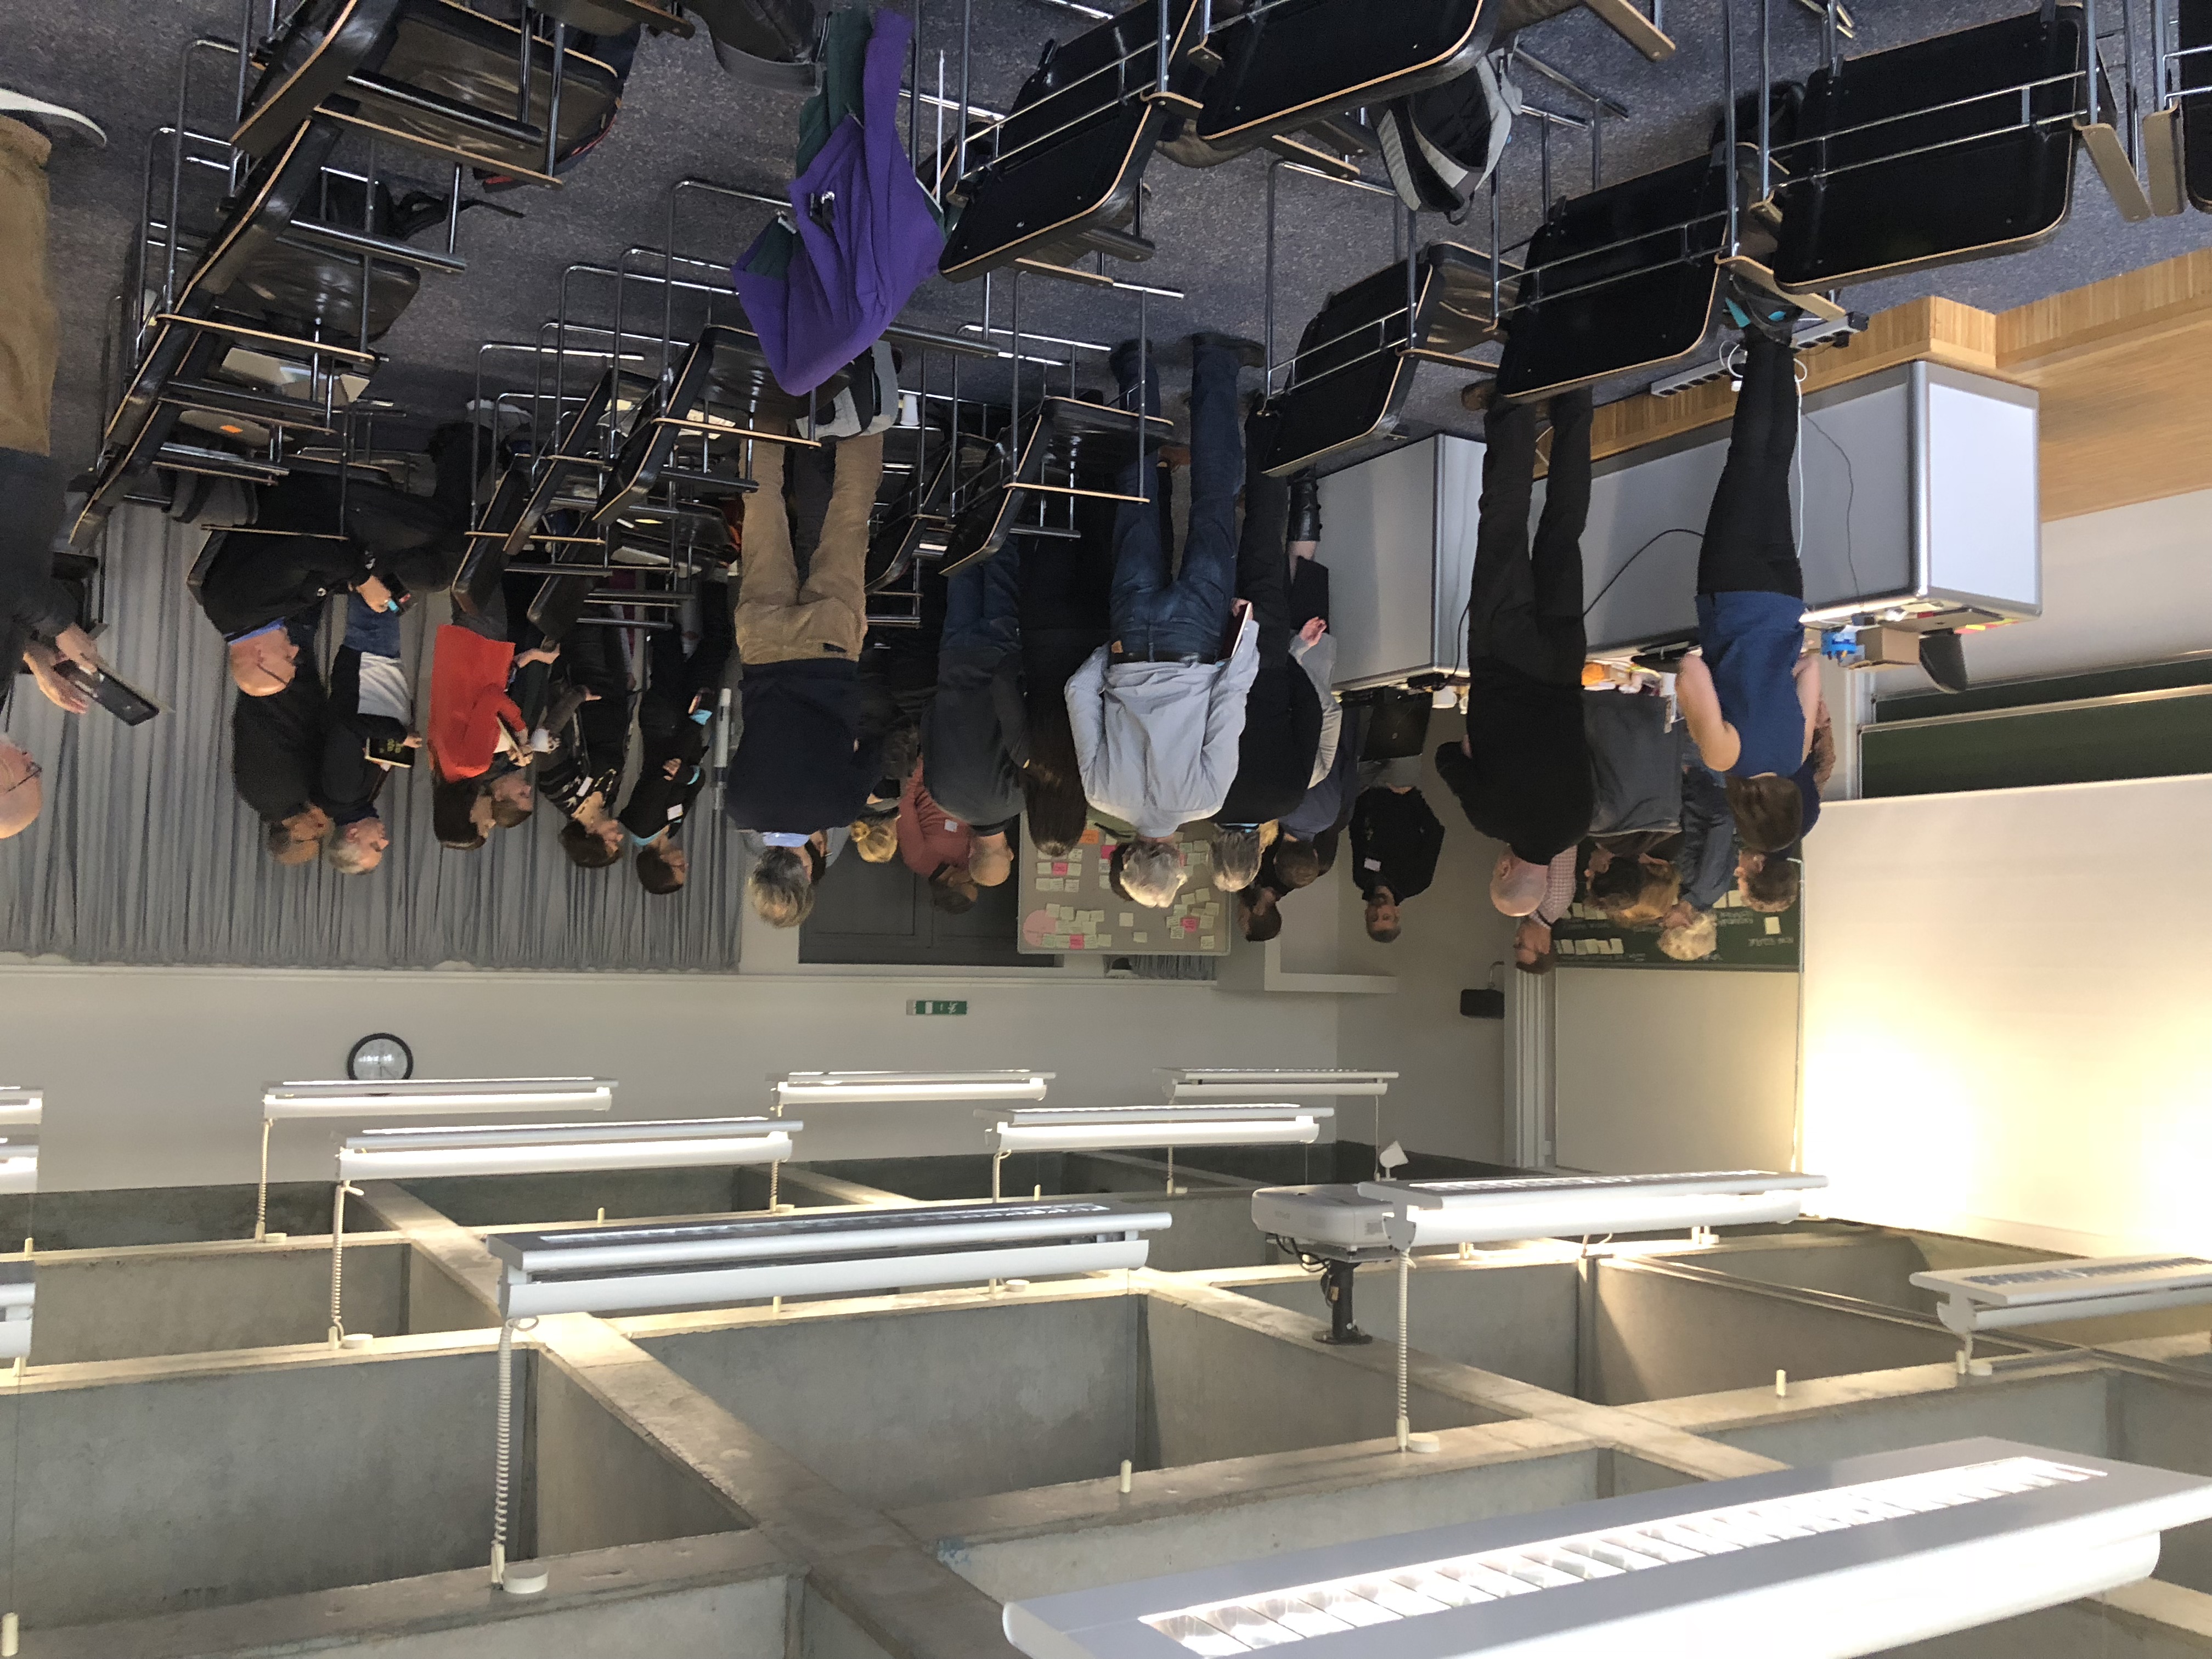
This Dagstuhl seminar brought together a diverse group of researchers and practitioners to explore the benefits and challenges of physicalization -- computer scientists trained in visualization, virtual reality and human-computer interaction; architects of virtual and augmented systems; perceptual and cognitive scientists; and artists and designers. Through interactive discussions and demonstrations, we explored physicalization, as a set of methodologies for representing data, for engaging audiences, and for artistic expression. There were no formal paper presentations. Instead, the work was done through interactive discussions, hands-on workshops, and interactive demonstrations outside the lecture hall. Figure 1 shows two examples of data physicalizations exhibited by our participants.
The Week at a Glance
Monday. After explaining various organization matters and formalities, the first day began with the physical construction of custom name badges. The hands-on session offered the first occasion to get to know each other, also by comparing the name badges themselves, then and during the whole duration of the seminar. After this session, each of the 40 participants gave a two-minute presentation of their achievements and interests in the field of physicalization. Some described their artistic creations based on data, some showed how mapping data onto physical dimensions enhanced data analysis. Others showed how scientists and artists collaborated to explain biological and physical principles through physicalization, or how principles of perception and cognition could be used to guide how data are effectively mapped onto visual dimensions. The electricity in the air was palpable; everyone realized that we were on the threshold of a new discipline. This energy drove the first deliverable for this seminar: Dagstuhl monograph, and perhaps a book, highlighting extended versions of these 40 contributions.

To allow a more focused approach towards yet unexplored research topics, the first activity focused on defining "pillars" of physicalization, crystallizing the learning and background of the different intellectual communities identified in our proposal. In break-out sessions, each group ideated around and then synthesized the most fundamental papers, examples, principles and challenges for their pillar, relative to physicalization. The Perception and Cognition Group focused on sensory processing, especially touch perception and embodied cognition, which deals with the way we learn about the world through our motor interactions with it. The Evaluation group shared their experiences in measuring human responses, and how methods might be extended to physicalization. The Design group explored artistic and design approaches to data physicalization. The Applications group identified existing and future application areas. The technology group surveyed the range of materials and devices for physicalization. In the reports-back, the group was encouraged to explore challenges and limitations for each of these core areas, to set the stage for the cross-disciplinary discussions beginning on Tuesday.
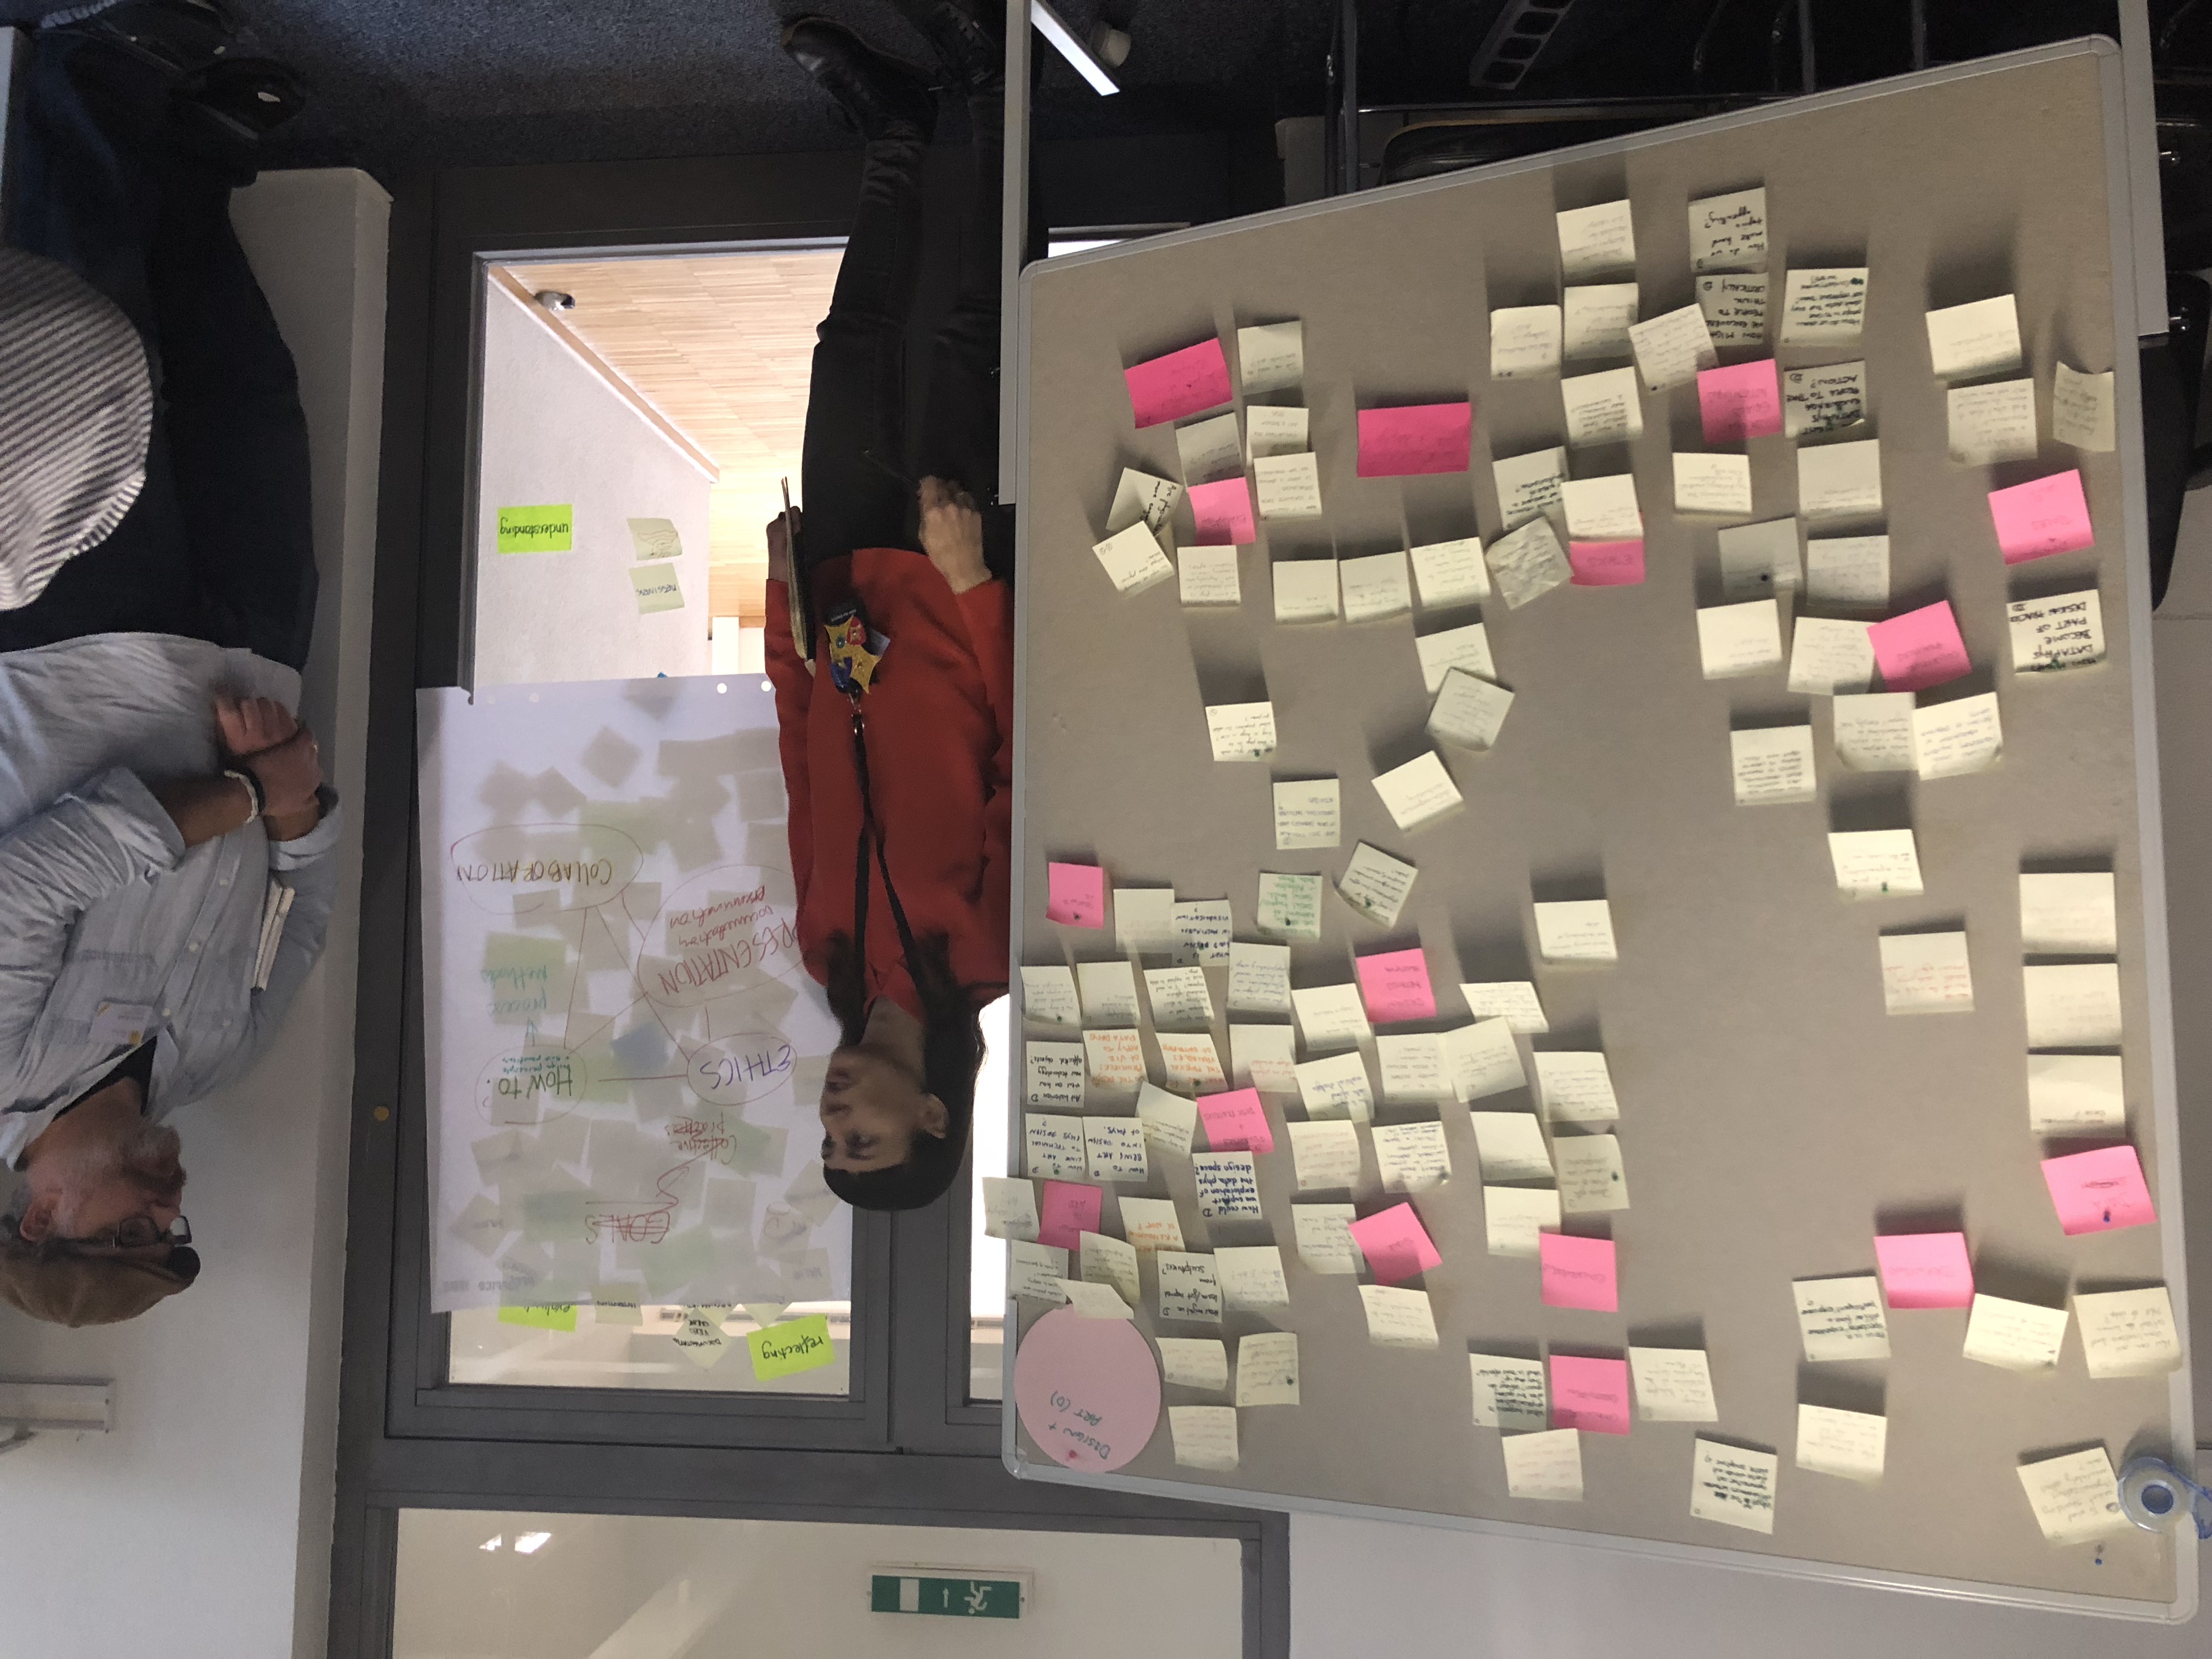
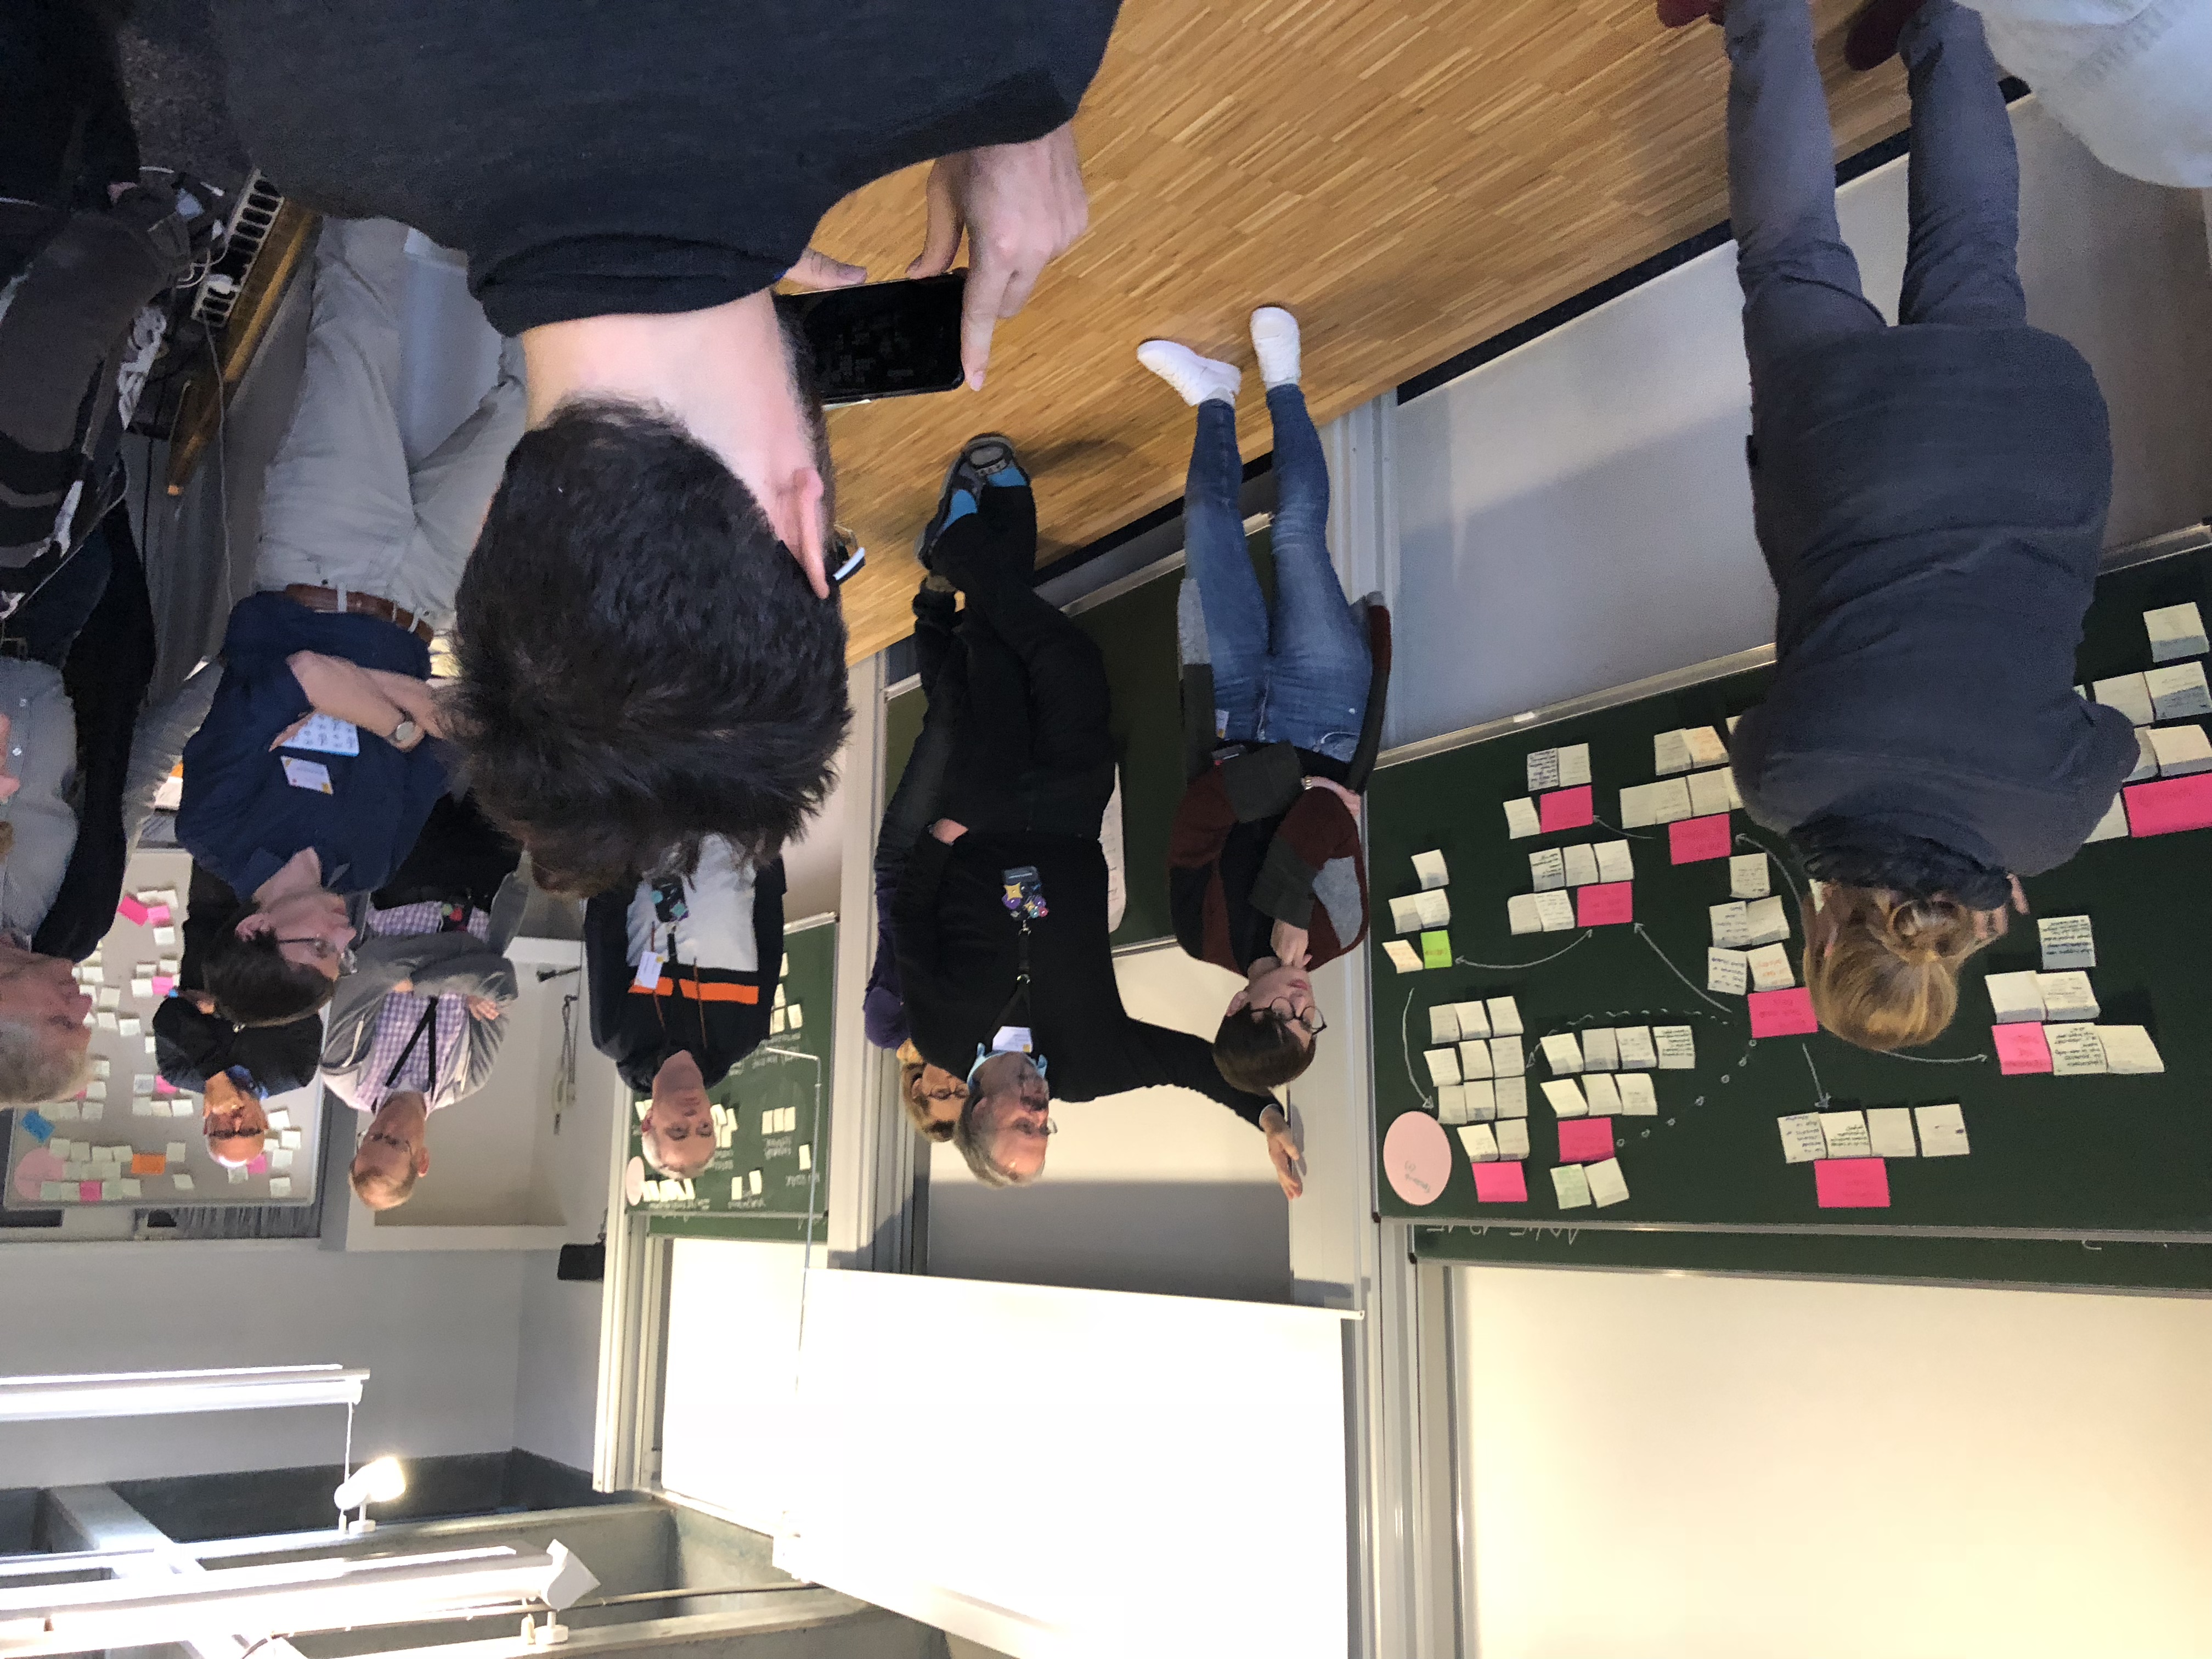
Tuesday. At the start the second day, each participant generated three questions for each of the five pillar areas. A massive exercise was undertaken wherein all these questions were organized and grouped into emergent categories. Spontaneous discussions started around the meaning and validity of the themes that emerged, as these would align the next round of thematic discussions (Figure 2). The "Design Patterns" group focused on identifying general templates for characterizing data physicalization. The "Emotion" group explored unique affordances that touching data enable. The Vis vs. Phys Group delved into the ways vision and touch were different, and what unique advantages that might enable. The "Critical" group explored the range of ethical and critical matters that could be related to physicalization practice in particular.
Wednesday. Wednesday morning was devoted to hands-on workshops where practitioners engaged small groups in interactive activities. Samuel Huron's group explored a set of physicalization examples, to identify common principles; Daniel Keefe demonstrated a virtual reality exploration of the human heart; Till Nagel, Laura Perovich, and Dietmar Offenhuber led a group into the forest to collect natural objects which they used to create physicalizations; Robert Friska provided surprising problem solving examples that drove a discussion about physical reasoning; Barbara Tversky showed examples of how physical gestures we make contribute to problem solving; Daniel Schneider led a workshop on computational embroidery, where the data are represented in yarn color and texture. By the time we piled into the bus for Trier, the large and diverse group of 40 had transformed into a dynamic community of scholars. Listening into the conversations, you could hear artists explaining how sculpture is taught in Art School, perceptual psychologists describing touch perception; and engineers revealing expertise on control systems for autonomous micro-robots.
Thursday. Thursday was the major work day. Building on the explorations of Tuesday, we divided into groups and worked on a variety of topics. One group, for example, focused on how to teach visualization and how to use data physicalization to teach other areas. Another group worked on a white paper on emotion and physicalization. Another worked on ideas for using physicalization for environmentally-situated projects. Another group focused on categorizing the critical considerations that emerged on Tuesday.
Friday. The final day aimed into transforming the progress of the past days into concrete contributions. For example, plans for a physicalization contest were discussed, ideas for the book of 40 contributions were pushed further, as well as on a special issue on physicalization for the Journal of Perceptual Imaging. Another group discussed the topic of scientific funding, among which the experience of past H2020 research proposals, and the potential of future research proposal initiatives that relate to physicalization.
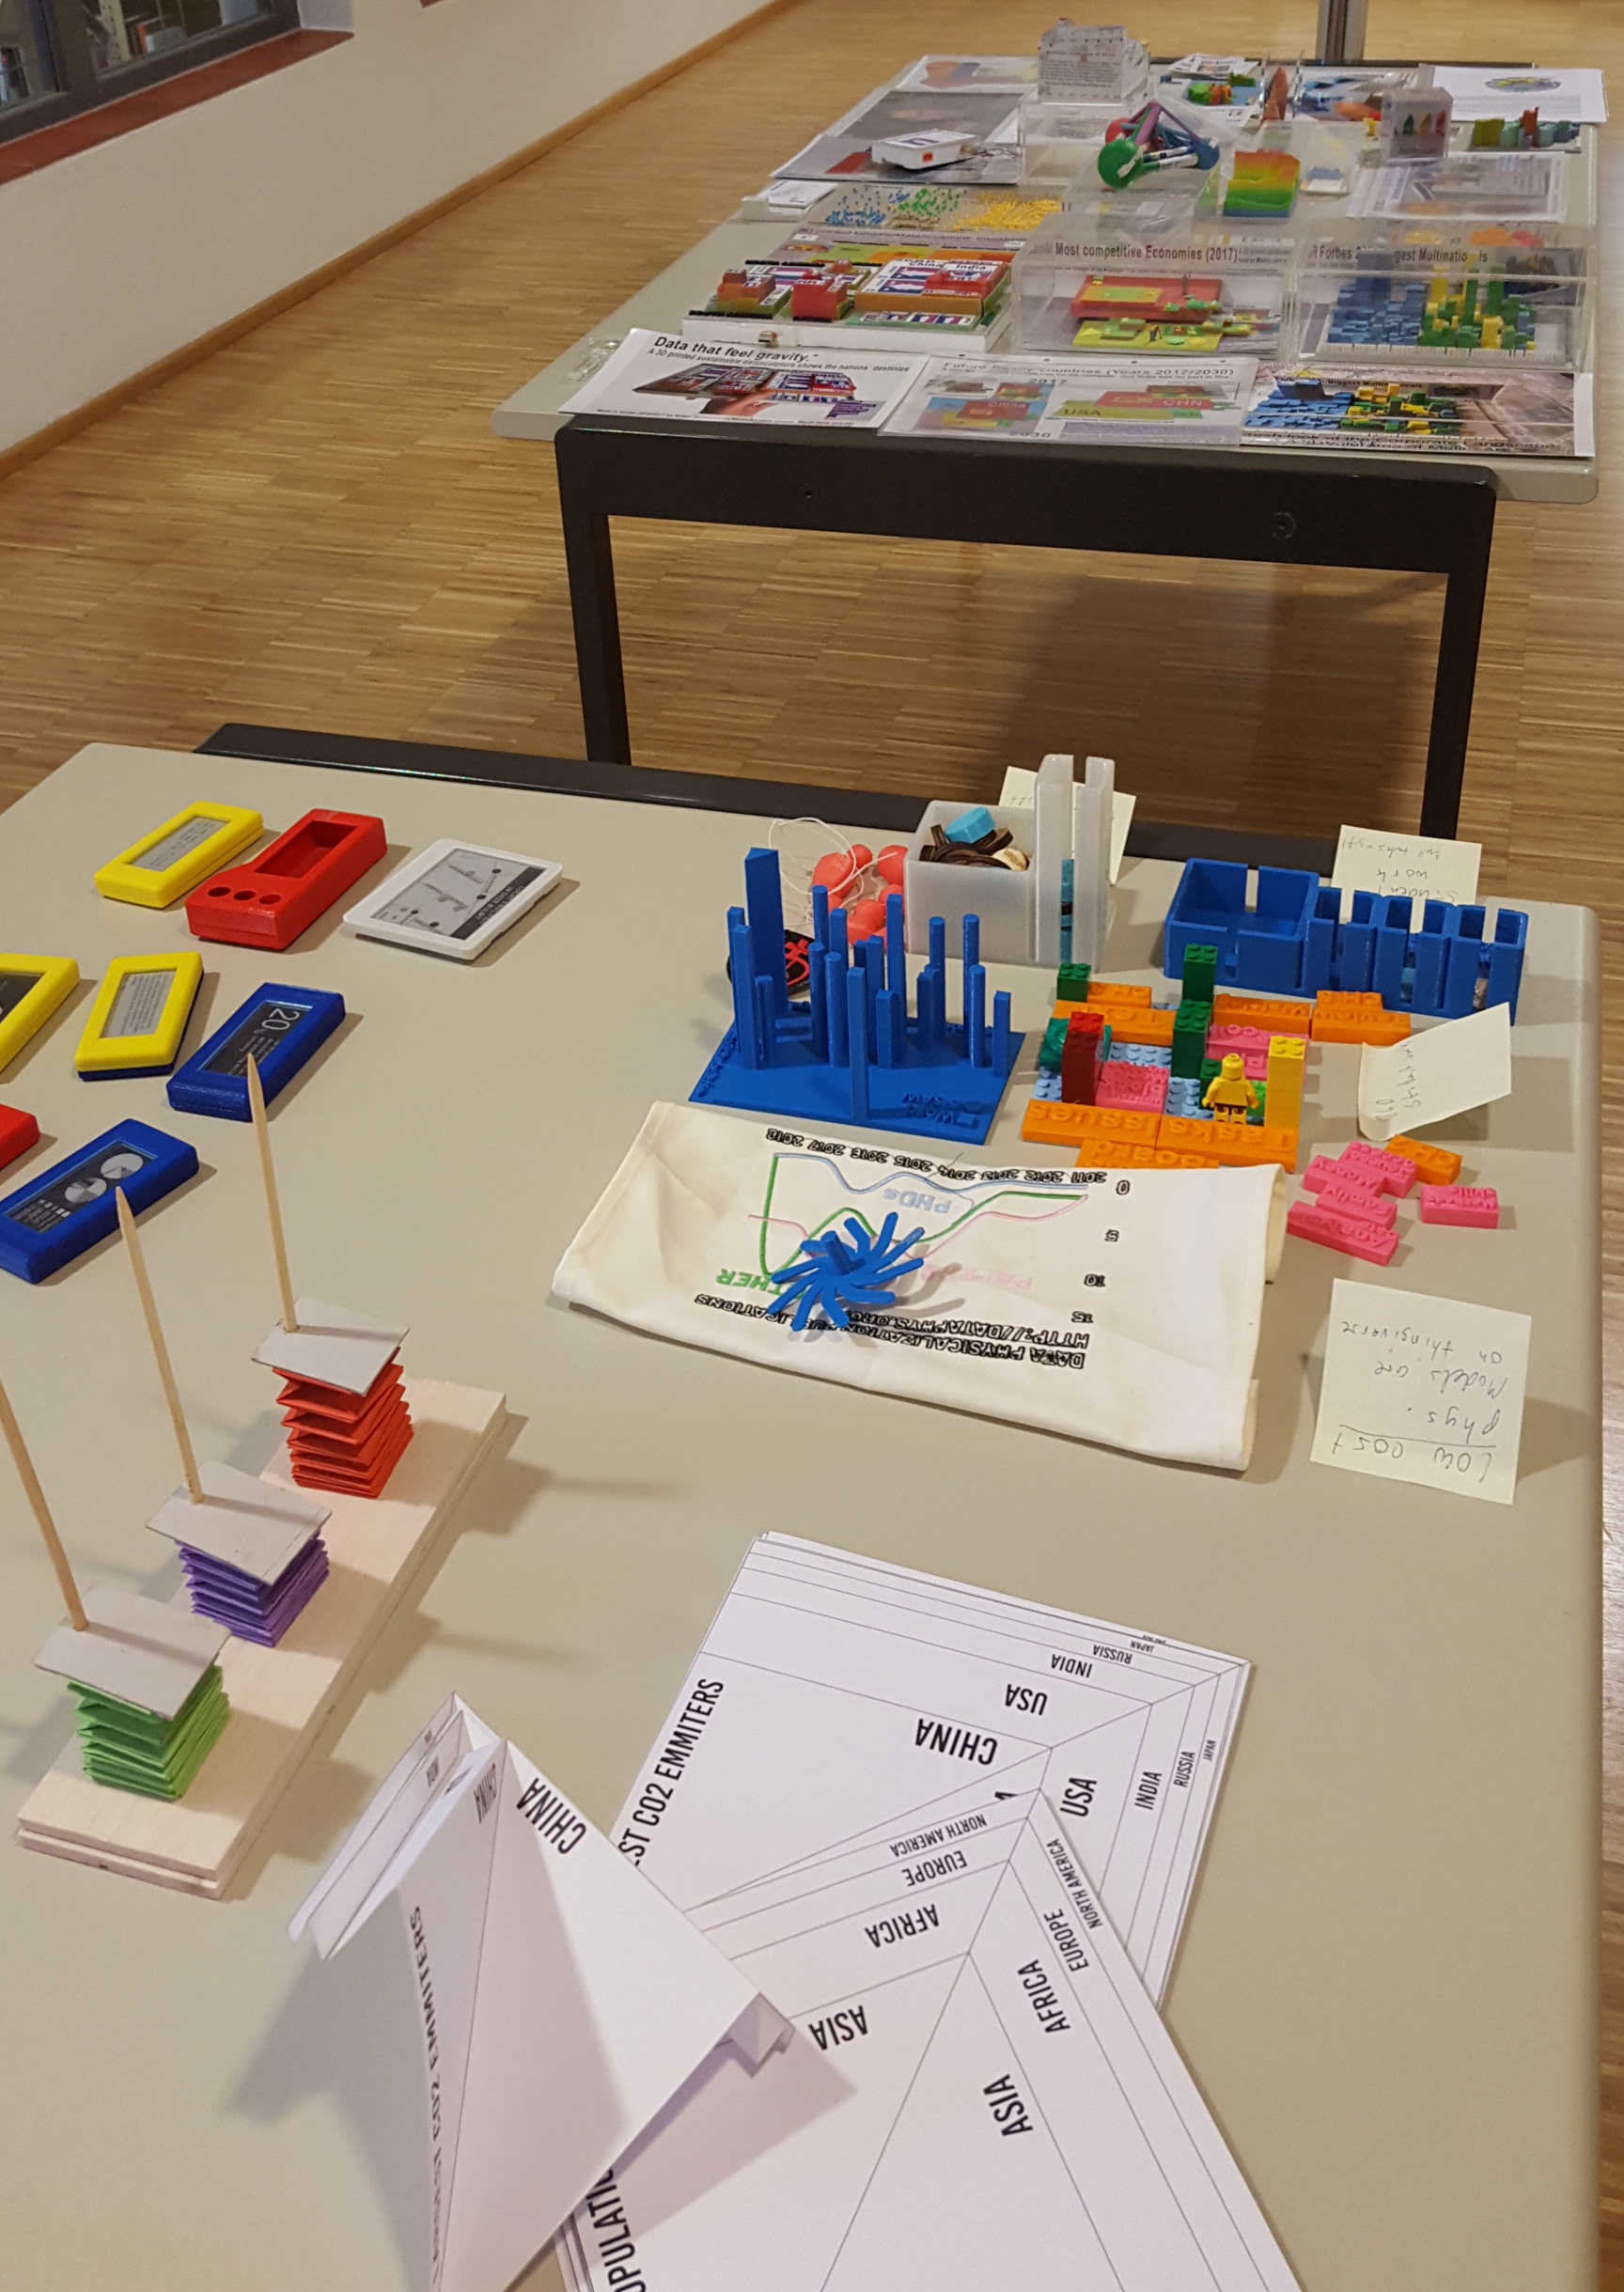
Hands-on Demonstrations
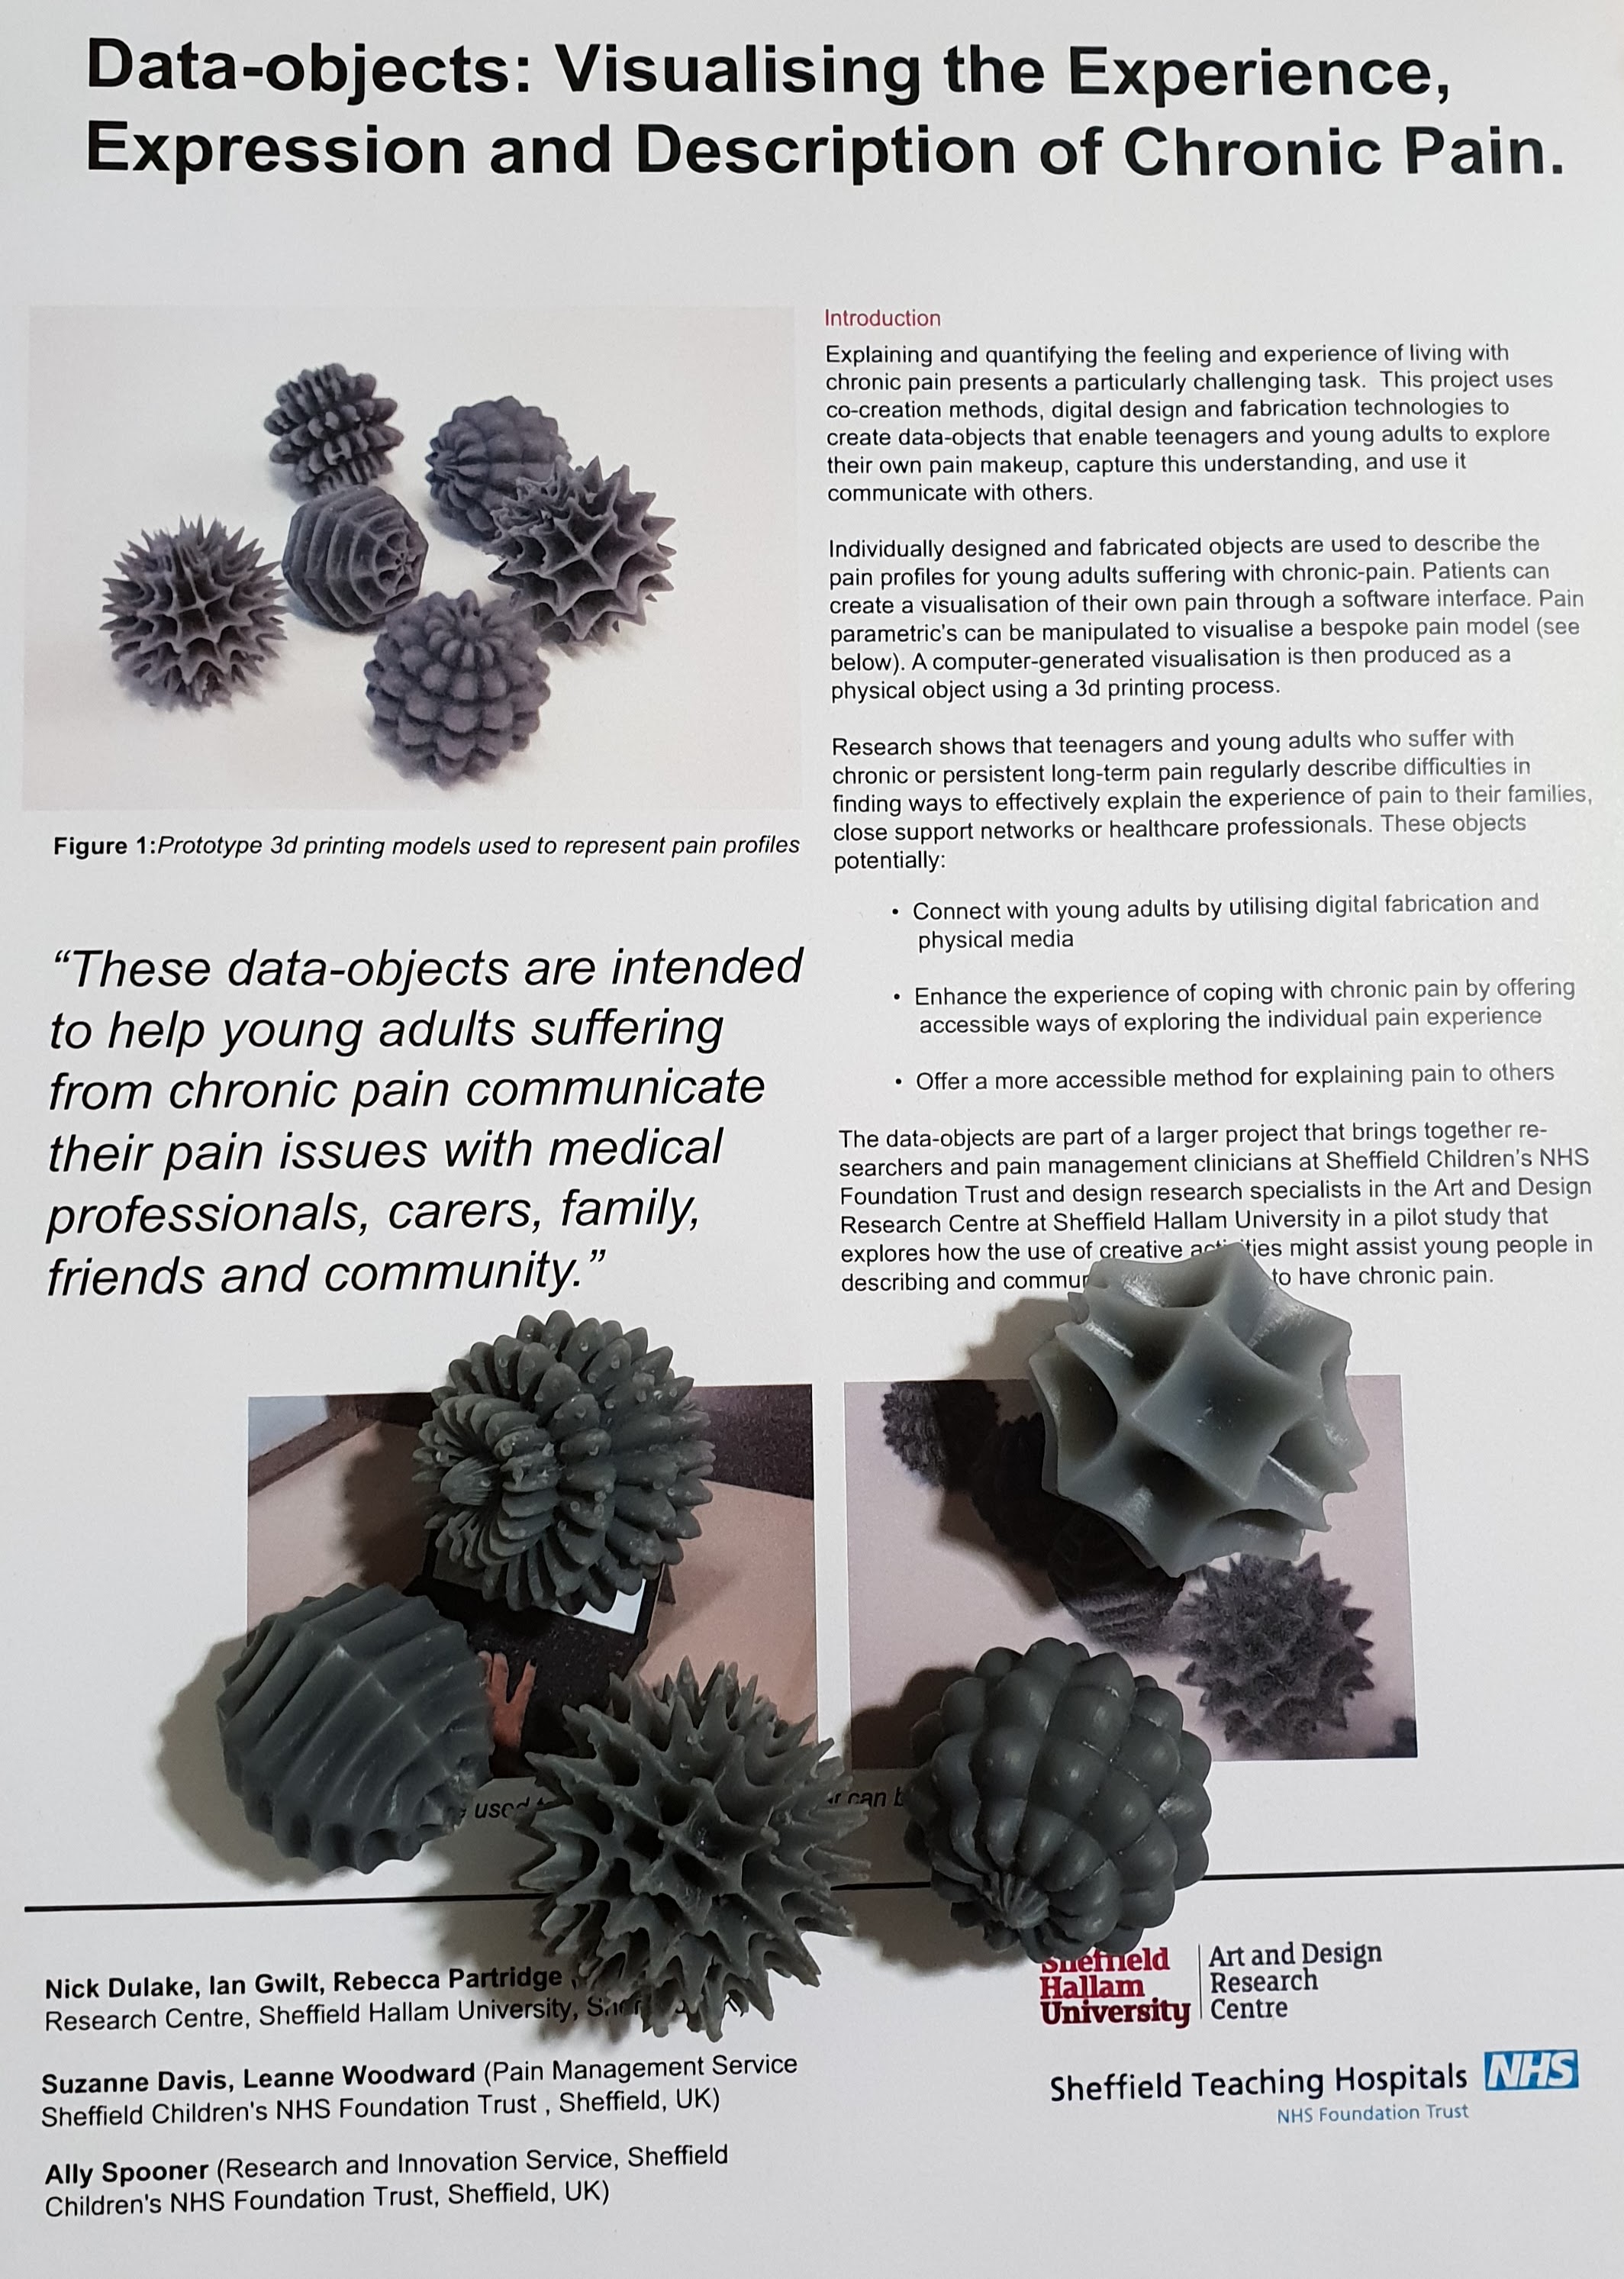
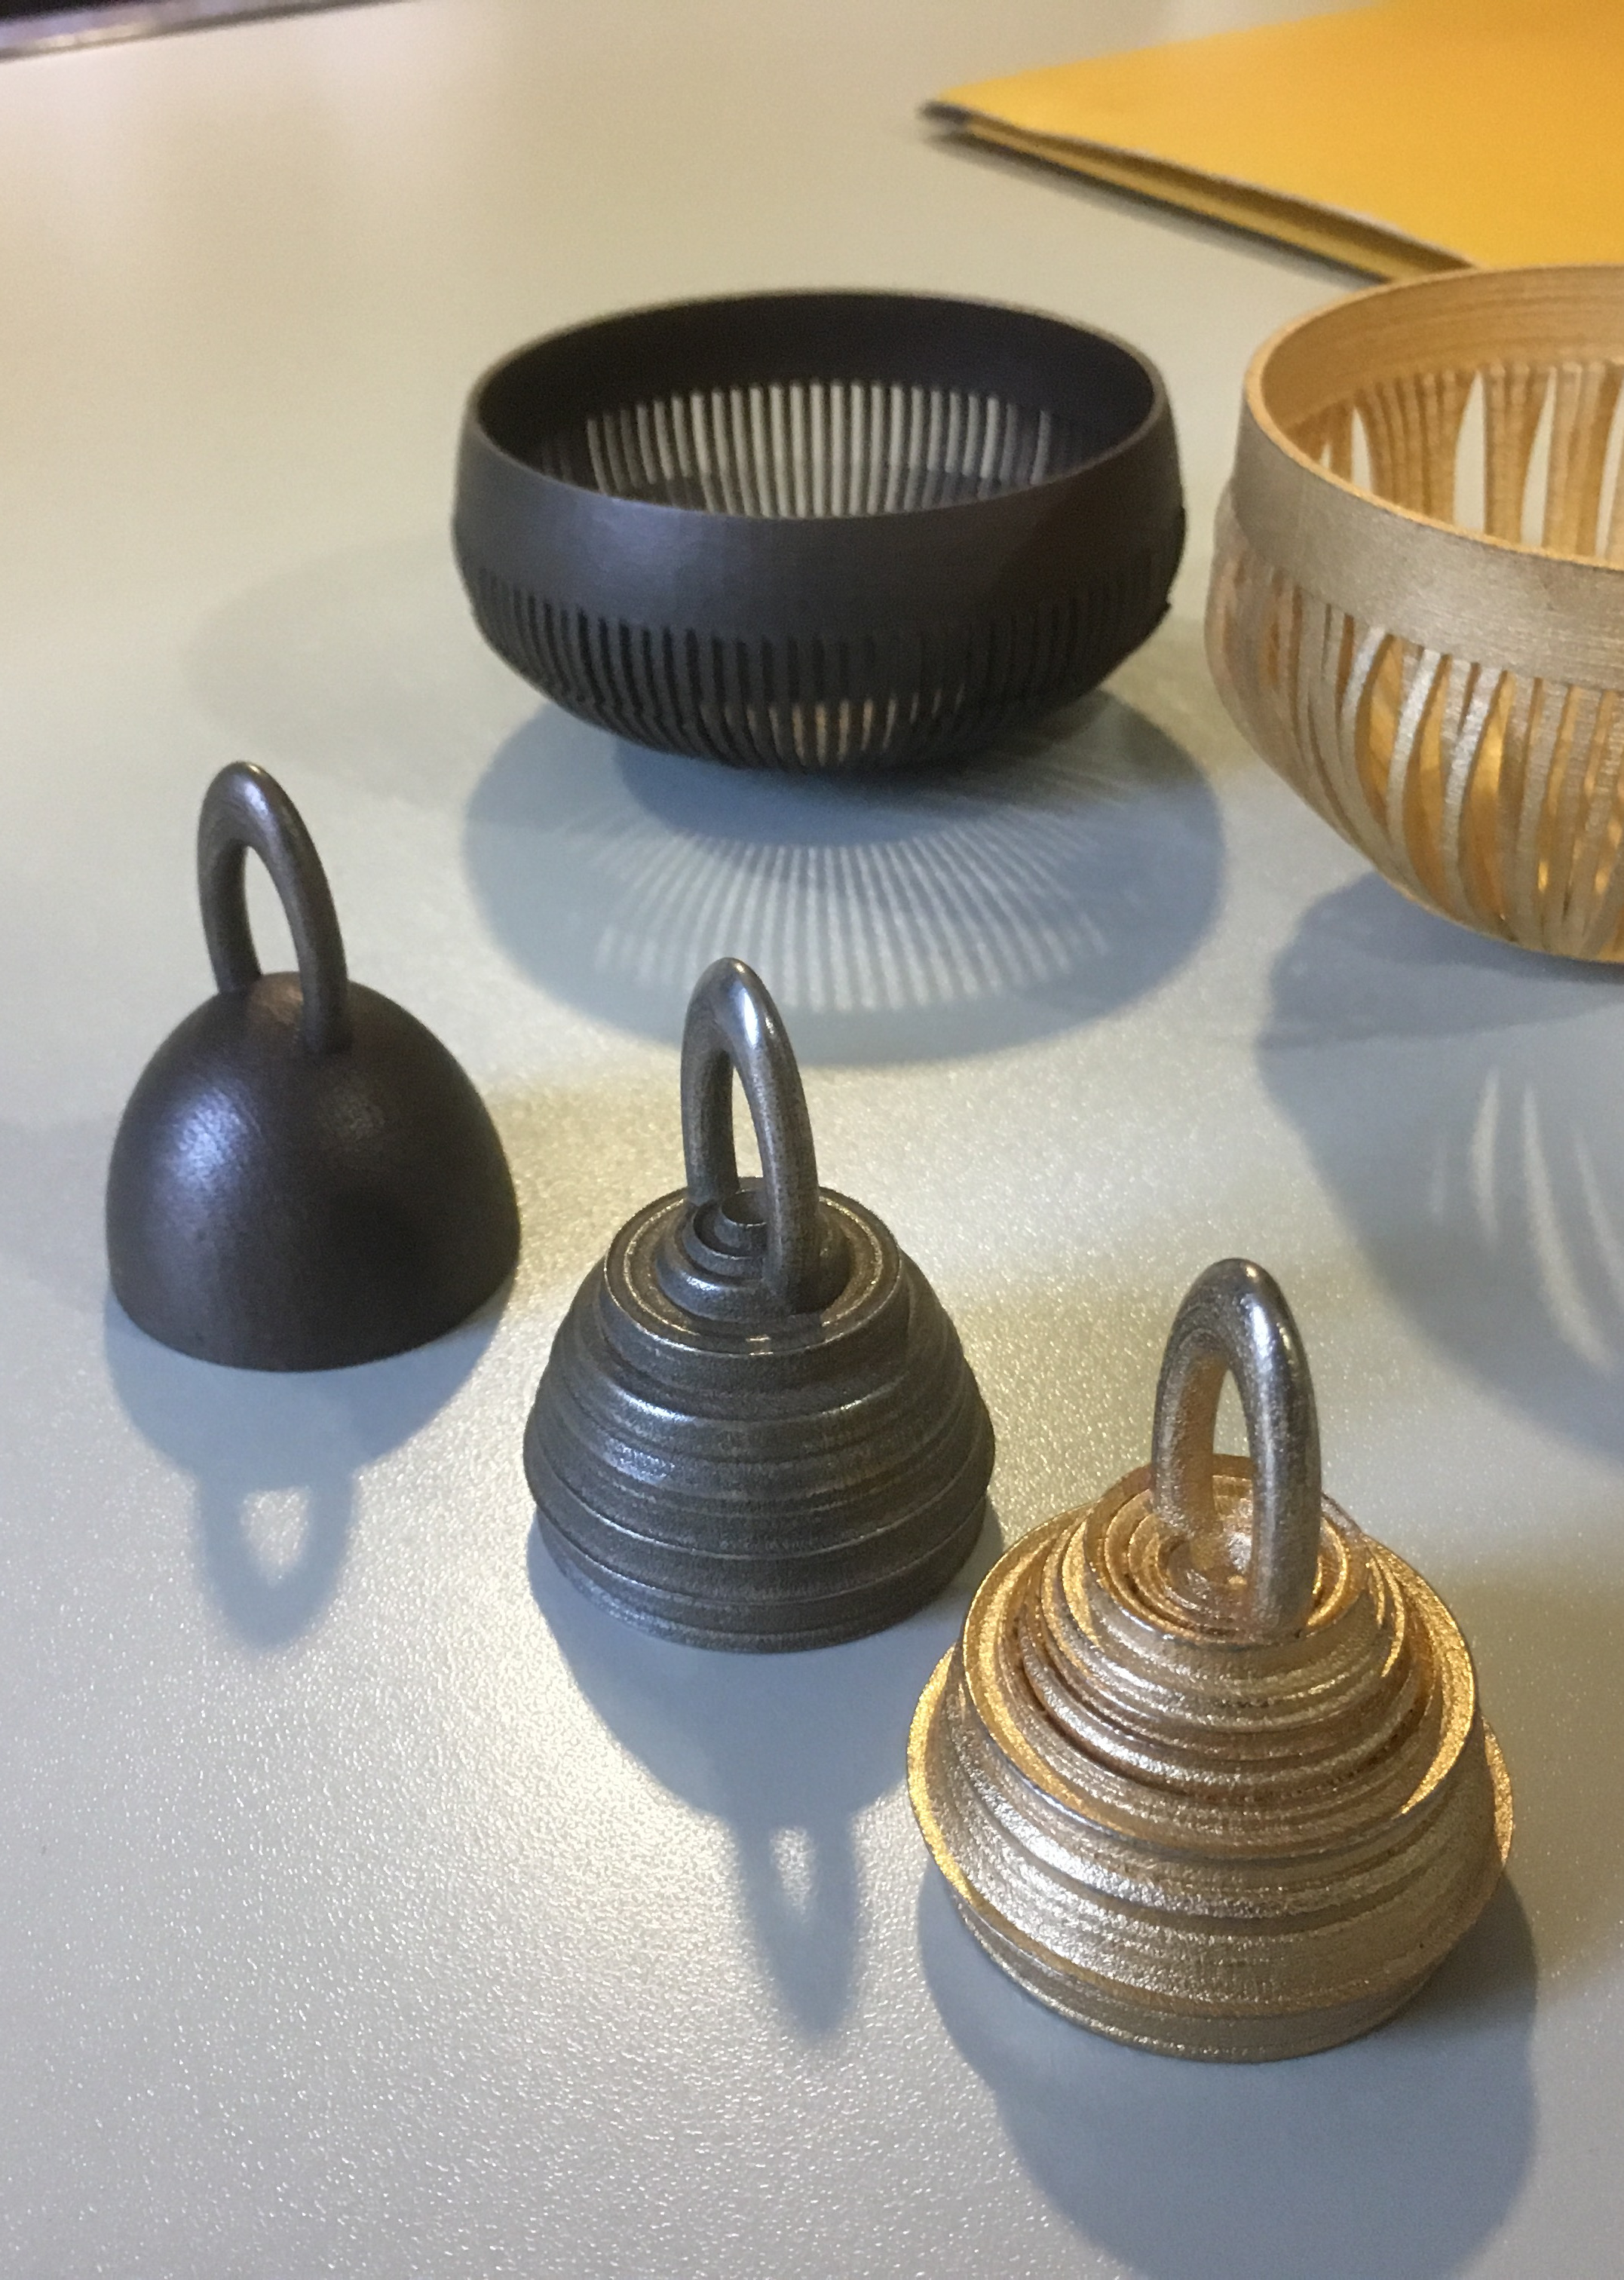
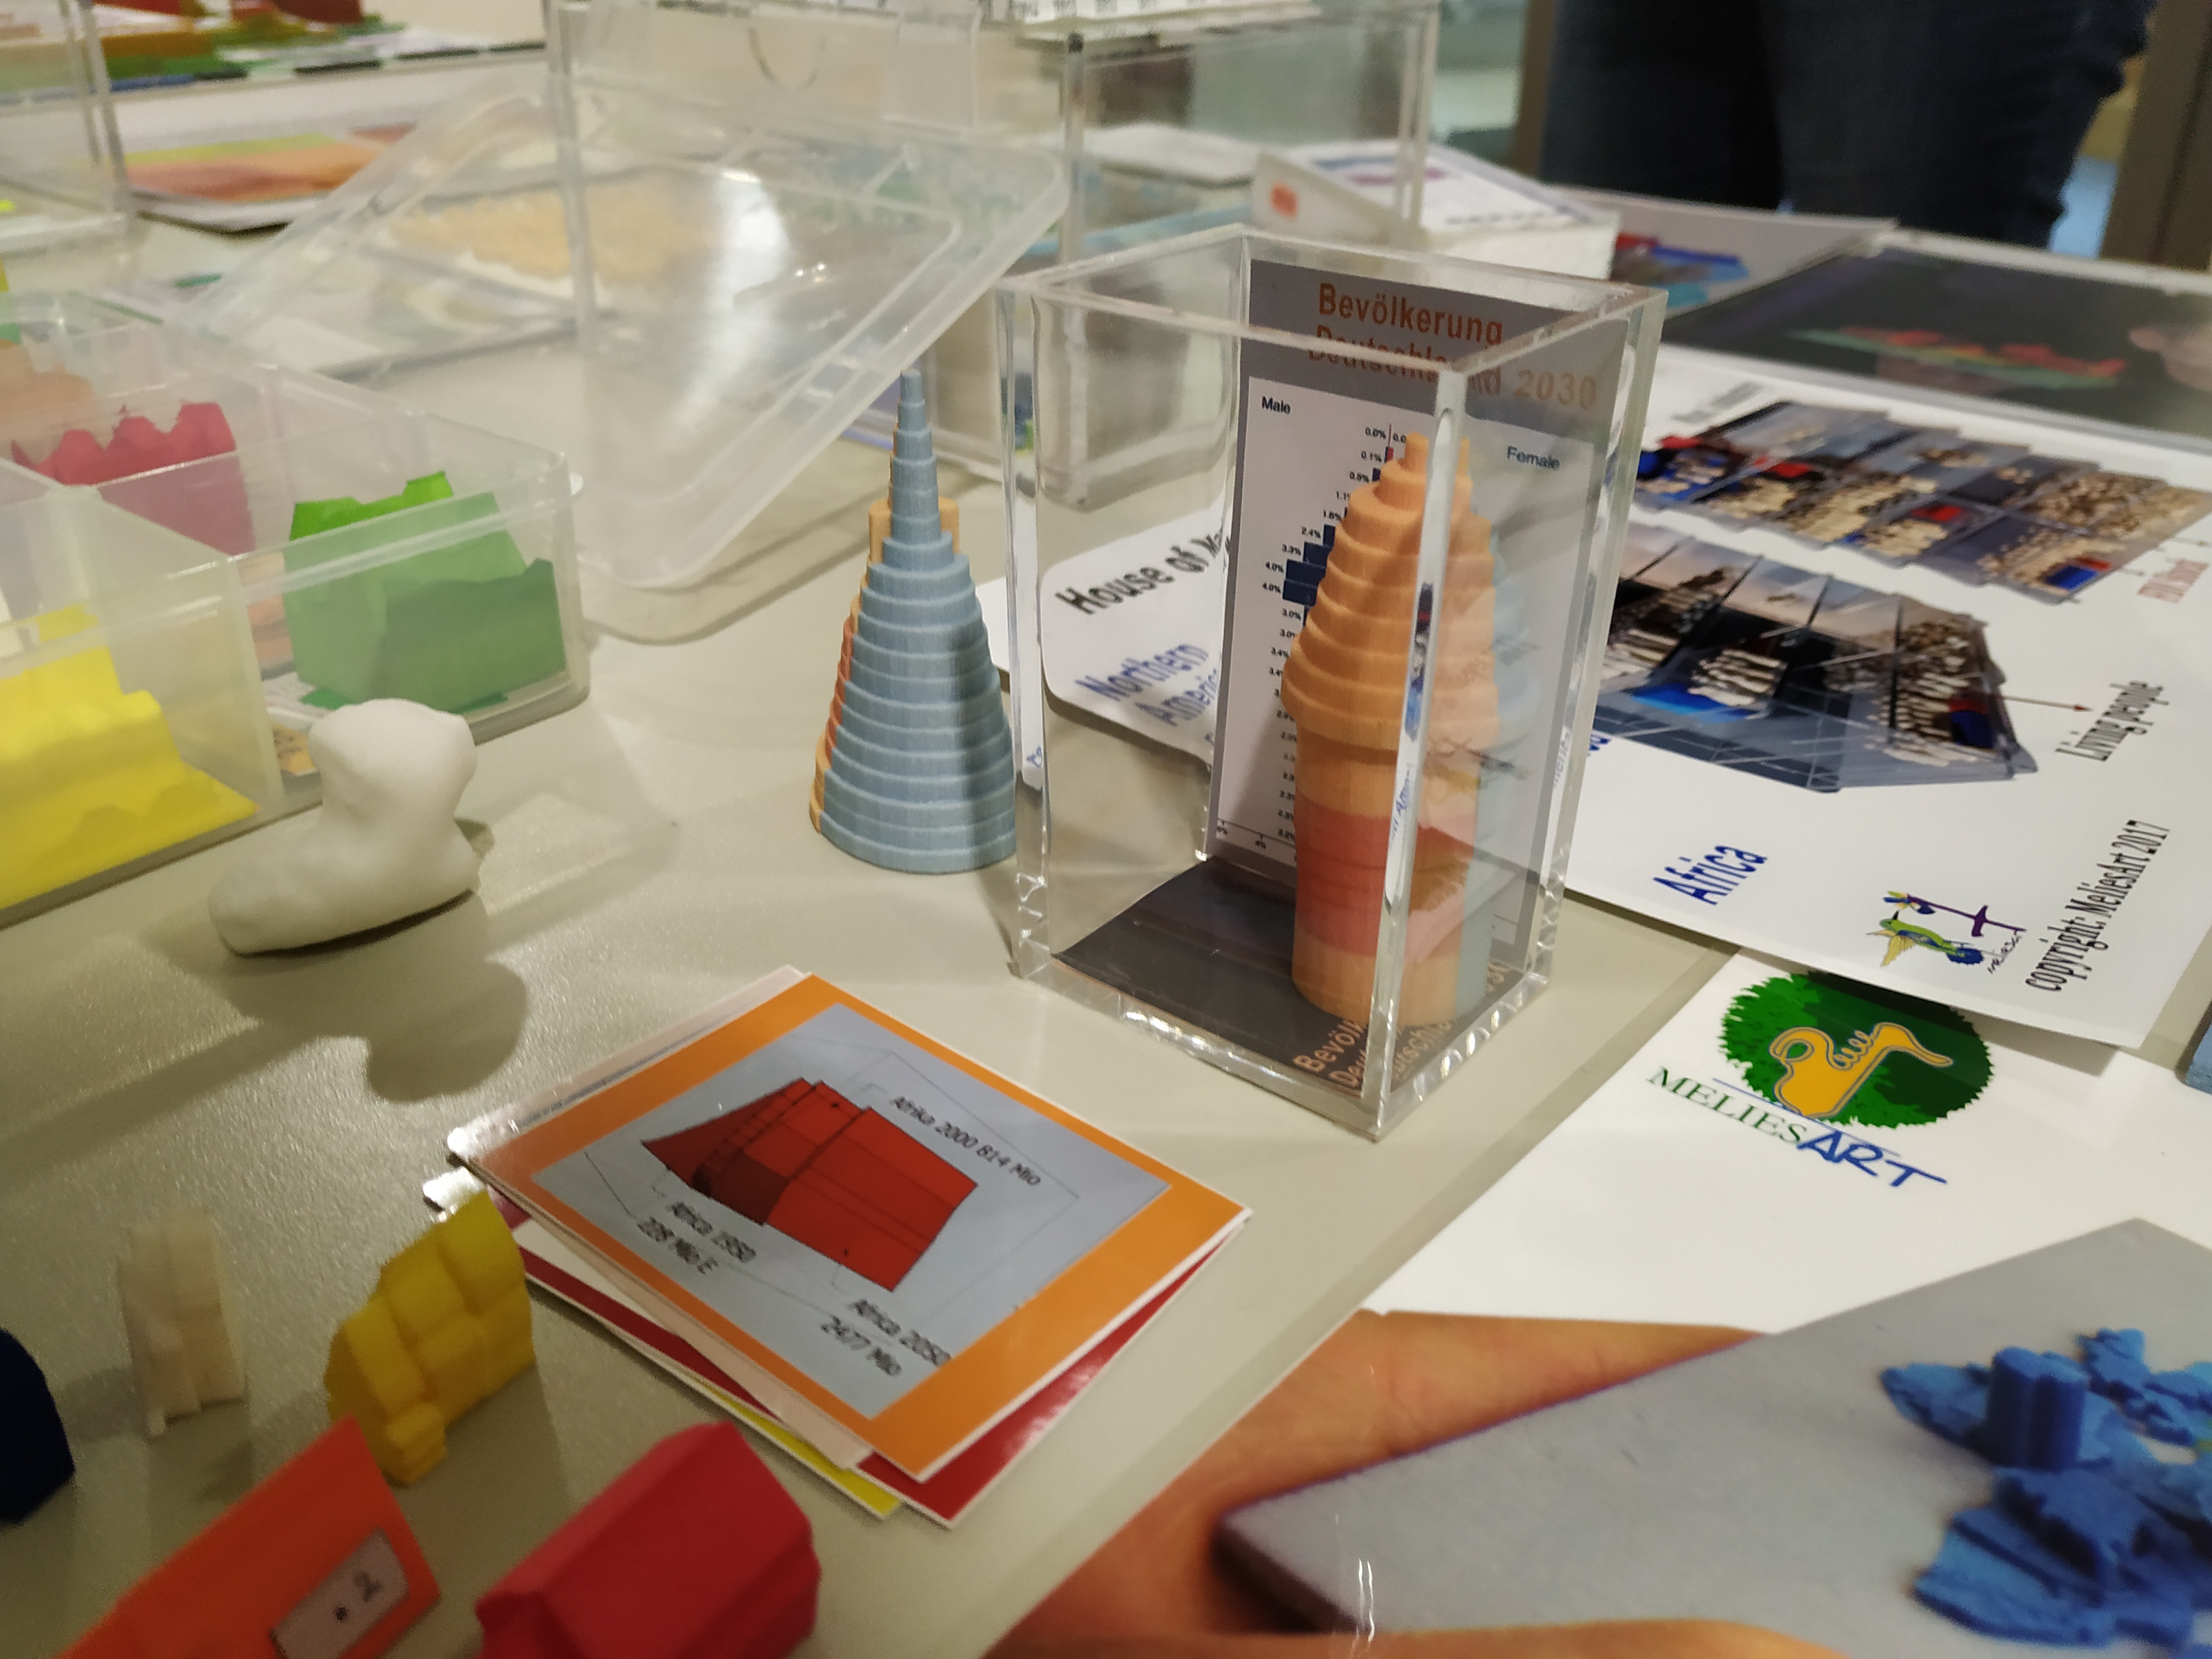
The area outside the main conference room was populated with demonstrations provided by the participants. For example, Andrew Vande Moere brought a wireless, networked display that allowed participants to vote about particular topics that were shown; Volker Schweinsfurth, Daniel Schneider, and many others brought along and exhibited 3-D printed, hand-crafted, or even embroidered physicalizations. Bernice Rogowitz ran participants through several experiments around the topics of touch perception and touch/vision interactions. Section 4 details several of the hands-on experiences seminar participants and organizers could engage in; while Figure 3 shows the diversity of the physical artifacts that participants exhibited.
Jason Alexander, Petra Isenberg, Yvonne Jansen, Bernice E. Rogowitz, Andrew Vande Moere
- Jason Alexander (Lancaster University, GB) [dblp]
- Stephen Barrass (Sonification - Ainslie, AU) [dblp]
- Stephen Brewster (University of Glasgow, GB) [dblp]
- Sheelagh Carpendale (University of Calgary, CA) [dblp]
- Tim Dwyer (Monash University - Caulfield, AU) [dblp]
- Leanne Elias (University of Lethbridge, CA)
- Yuri Engelhardt (University of Twente - Enschede, NL) [dblp]
- Sean Follmer (Stanford University, US) [dblp]
- Denton Fredrickson (University of Lethbridge, CA)
- Christian Freksa (Universität Bremen, DE) [dblp]
- Pauline Gourlet (University of Paris VIII, FR) [dblp]
- Ian Gwilt (University of South Australia, AU) [dblp]
- Sarah Hayes (Cork Institute of Technology, IE) [dblp]
- Uta Hinrichs (University of St Andrews, GB) [dblp]
- Trevor Hogan (Cork Institute of Technology, IE) [dblp]
- Eva Hornecker (Bauhaus-Universität Weimar, DE) [dblp]
- Samuel Huron (Telecom ParisTech, FR) [dblp]
- Jörn Hurtienne (Universität Würzburg, DE) [dblp]
- Petra Isenberg (INRIA Saclay - Orsay, FR) [dblp]
- Daniel Keefe (University of Minnesota - Minneapolis, US) [dblp]
- David Kirsh (University of California - San Diego, US) [dblp]
- Roberta Klatzky (Carnegie Mellon University, US)
- Till Nagel (Hochschule Mannheim, DE) [dblp]
- Bettina Nissen (University of Edinburgh, GB) [dblp]
- Lora Oehlberg (University of Calgary, CA) [dblp]
- Dietmar Offenhuber (Northeastern University - Boston, US) [dblp]
- Laura Perovich (MIT - Cambridge, US) [dblp]
- Bernice E. Rogowitz (Visual Perspectives - New York & Columbia University - New York, US) [dblp]
- Daniel K. Schneider (University of Geneva, CH) [dblp]
- Volker Schweisfurth (Melies Art - Düsseldorf, DE)
- Adrien Segal (California College of the Arts, US)
- Aurélien Tabard (Université de Lyon, FR) [dblp]
- Barbara Tversky (Columbia Teachers College - New York, US & Stanford University, US) [dblp]
- Brygg Ullmer (Clemson University, US) [dblp]
- Andrew Vande Moere (KU Leuven, BE) [dblp]
- Karin von Ompteda (The Ontario College of Art and Design University, CA) [dblp]
- Yun Wang (Microsoft Research - Beijing, CN) [dblp]
- Wesley J. Willett (University of Calgary, CA) [dblp]
Classification
- society / human-computer interaction
Keywords
- Information visualization
- human-computer interaction
- data physicalization
- beyond-desktop visualization
- perception