Dagstuhl Seminar 21152
Multi-Level Graph Representation for Big Data Arising in Science Mapping
( Apr 11 – Apr 16, 2021 )
(Click in the middle of the image to enlarge)
Permalink
Please use the following short url to reference this page:
https://www.dagstuhl.de/21152
Organizers
- Katy Börner (Indiana University - Bloomington, US)
- Stephen Kobourov (University of Arizona - Tucson, US)
Contact
- Shida Kunz (for scientific matters)
- Susanne Bach-Bernhard (for administrative matters)
Schedule
For centuries, cartographic maps have guided human exploration. While being rather imperfect initially, they helped explorers find promised lands and return home safely. Recent advances in data, algorithms, and computing infrastructures make it possible to map humankind's collective scholarly knowledge and technology expertise by using topic maps on which “continents” represent major areas of science (e.g., mathematics, physics, or medicine) and zooming reveals successively more detailed subareas. Basemaps of science and technology are generated by analyzing citations links between millions of publications and/or patents. “Data overlays” (e.g., showing all publications by one scholar, institution, or country or the career trajectory of a scholar as a pathway) are generated by science-locating relevant publication records based on topical similarity. Despite the demonstrated utility of such maps, current approaches do not scale to the hundreds of millions of data records now available. The main challenge is designing efficient and effective methods to visualize and interact with more than 100 million scholarly publications at multiple levels of resolution.
This Dagstuhl Seminar will bring together researchers in cartography, information visualization, science of science, and graph drawing to discuss novel graph mining and layout algorithms and their application to the development of science mapping standards and services. We will also organize an exhibition of art contributed by scientists and science maps contributed by artists, and use this to stimulate discussion.
One of our main goals is to create a special journal issue on the topics related to the development of the next generation science map, SciMap2020. Among others, we will aim to answer:
- What data is most robust to design SciMap2020?
- What information should the nodes and link encode in SciMap2020?
- What user experience metaphors, functionality, and interactive user interfaces are best?
- What user studies should be run to compare options and study knowledge gains?
On the algorithmic front, specific research problems include:
- Construct a hierarchy of graphs, so that each represents the underlying large graph well
- Study the complexity of underlying problem: computing multi-level graph sketches
- Design efficient algorithms for computing multi-level graph sketches and clustering
- Design graph layout algorithms, driven by multi-level sketches and clustering
We look forward to a stimulating week that brings together world-leading experts to tackle these research challenges.
 Creative Commons BY 3.0 DE
 Katy Börner and Stephen G. Kobourov
Drawing from across cultures and across scholarly disciplines, the Places & Spaces: Mapping Science traveling exhibit demonstrates the power of maps (visualizations) to address vital questions about the contours and content of scientific knowledge.
Networks are all around us. At any moment in time we are driven by, and are an integral part of, many interconnected and dynamically changing networks. Our species has evolved in the context of diverse ecological, biological, social, and other types of networks over thousands of years. We created telephone and power networks, road and airline networks, the Internet and the World Wide Web. We model biological processes with metabolic and protein networks, fake news and rumors with epidemic networks, and even the brain with neural networks. The study of such large-scale networks is one of the prominent generators of big data. Analyzing, exploring, and understanding these complex, interdependent, multi-level networks requires new, more efficient, and more intuitive graph analysis and visualization approaches. This is confirmed in a 2017 VLDB study by Sahu et al. about how graphs are used in practice, where analysts identified scalability and visualization as the most important issues to address.
Recent advances in data, algorithms, and computing infrastructures make it possible to map humankind's collective scholarly knowledge and technology expertise by using topic maps on which "continents" represent major areas of science (e.g., mathematics, physics, or medicine) and zooming reveals successively more detailed subareas. Basemaps of science and technology (S&T) are generated by analyzing citations links between millions of publications and/or patents. "Data overlays" (e.g., showing all publications by one scholar, institution, or country or the career trajectory of a scholar as a pathway) are generated by science-locating relevant publication records based on topical similarity. Science maps are widely used to compare expertise profiles, to understand career trajectories, and to communicate emerging areas. The recent National Academy of Science Colloquium on Modeling and Visualizing Science Developments co-organized by Börner showcased the utility of predictive modeling and large-scale mapping efforts, e.g., in support of ranking institutions, analyzing job market developments, and innovation diffusion and technology adoption.
Despite the demonstrated utility of large-scale S&T maps, current approaches do not scale to the hundreds of millions of data records now available. Most users have a hard time reading large-scale networks and few can traverse or derive knowledge from multi-level presentations of networks. Most maps of science, technology, or jobs data support exactly one level of detail. Very few even support two levels such as the UCSD map of science. A key challenge is designing efficient and effective methods to visualize and interact with more than 100 million scholarly publications at multiple levels of resolution.
Given results from our prior studies on the effectiveness and memorability of map-like visualization of large graphs, we are interested to bring together leading experts to design a multi-level, large-scale map of science that can be used by experts and the general public alike.
The notion of multiple-levels-of-detail graph representation can be captured with Multi-Level Graph Sketches (MLGS) that take a static map-like representation to a multi-level setting needed for exploring and interacting with large, real-world networks. Using the familiar map metaphor, multi-level graph algorithms can make it possible to identify important nodes, major pathways, and clusters across multiple levels. Specifically, we aim to develop efficient algorithms with theoretical and practical guarantees for creating Multi-Level Graph Sketches (MLGS) in support of visual analytics tasks for large network exploration, navigation, and communication. Unlike existing methods for visualizing multi-level networks based on meta-nodes and meta-edges, the MLGS approach can provide real nodes (prototypes) and real paths (backbones) for each level, similar to geographic maps that show real cities and real roads at every level of detail.
Research questions included: (1) designing efficient algorithms for MLGS: advance the state-of-the-art in graph algorithms by generalizing the notion of graph spanners to multiple levels. (2) utilizing MLGS algorithms in visualization: applying the MLGS representation in the context of network analysis and visualization for interacting with large networks, which combines the MLGS approach with clustering, layout, and map-like visualization. (3) developing a new approach for science classification, lookup, and topical mapping service in support of data-driven decision making by students, teachers, and administrators. (4) validating the new algorithms and visualizations: evaluation based on quantitative metrics such as efficiency/scalability, stress/distortion and precision/recall, as well as qualitative metrics based on human subject studies of the utility of visualizations along with readability, engagement, and memorability.
The main goal of this seminar was to bring together researchers coming from information visualization, psychology, cognitive science, human-computer interaction, graph drawing, computational geometry, cartography, and GIS with interests in "science of science" to discuss novel graph mining and layout algorithms and their application to the development of science mapping standards and services.
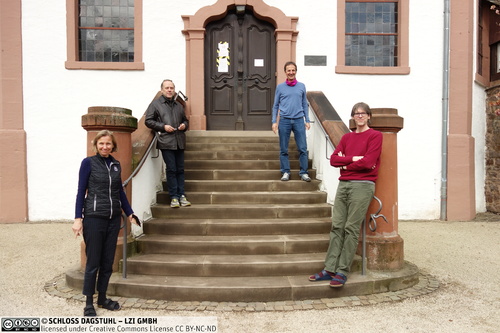
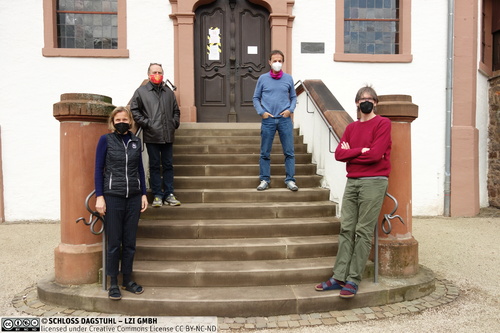
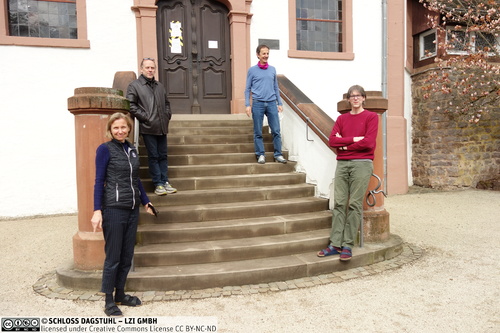
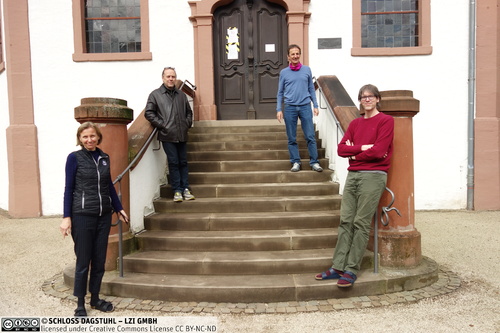
Due to the pandemic, we had a "hybrid" seminar with only 5 in-person participants and 25 by-zoom participants; see Fig. 1. With participants from more than 10 different countries and at least 5 different time-zones (some as much as 9 hours behind Central Dagstuhl time), this was a new experience for most of us and definitely different from previous Dagstuhl seminars. Nevertheless, we attempted to adapt by having additional evening events and moving the traditional Wednesday excursion to the morning.
As this was a highly interdisciplinary seminar, we started the event with talks that introduced the state of the art in the participating fields on a high level. After the introductory presentations, we presented our initial research problems and discussed further questions in an open-problem session.
A set of 4-6 research problems was then finalized and the formation of working groups for these problems was completed by the end of the second day. The remaining three days were dedicated to working-group meetings, progress reports, and initial write-ups.
The main expected outcome of this seminar will be a special issue of the journal IEEE Computer Graphics and Applications on the main topics of the seminar. Specifically, we expect 4-6 research papers on the problems discussed by the working groups. Longer term goals include: improved collaborations and communications between the different communities brought together for this seminar, improved maps of science for SciMap2020, and new multi-level graph algorithms and approaches.
Katy Börner and Stephen G. Kobourov
On-site
Remote:
- Patrizio Angelini (John Cabot University - Rome, IT) [dblp]
- Michael A. Bekos (Universität Tübingen, DE) [dblp]
- Kevin Boyack (SciTech Strategies Inc. - Albuquerque, US) [dblp]
- David Chavalarias (CNRS - Paris, FR)
- Giuseppe Di Battista (University of Rome III, IT) [dblp]
- Sara Irina Fabrikant (Universität Zürich, CH) [dblp]
- Jean-Daniel Fekete (INRIA Saclay - Orsay, FR) [dblp]
- Lynda Hardman (CWI - Amsterdam, NL & Utrecht University, NL) [dblp]
- Ben Jacobsen (University of Arizona - Tucson, US)
- Philipp Kindermann (Universität Trier, DE) [dblp]
- Karsten Klein (Universität Konstanz, DE) [dblp]
- Stephen Kobourov (University of Arizona - Tucson, US) [dblp]
- Thomas Köhler (TU Dresden, DE)
- Vincent Larivière (University of Montreal, CA) [dblp]
- Tamara Mchedlidze (Utrecht University, NL) [dblp]
- Guy Melançon (University of Bordeaux, FR) [dblp]
- Staša Milojevic (Indiana University - Bloomington, US)
- Filipi Nascimento Silva (Indiana University - Bloomington, US)
- Martin Nöllenburg (TU Wien, AT) [dblp]
- Adam Ploszaj (University of Warsaw, PL)
- Sergey Pupyrev (Facebook - Menlo Park, US) [dblp]
- Chrysanthi Raftopoulou (National Technical University of Athens, GR) [dblp]
- Andrea Scharnhorst (Royal Netherlands Academy of Arts and Sciences, NL) [dblp]
- André Skupin (San Diego State University, US) [dblp]
- Cassidy Rose Sugimoto (Indiana University - Bloomington, US)
- Antonios Symvonis (National TU - Athens, GR) [dblp]
- Markus Wallinger (TU Wien, AT)
- Angela Zoss (Duke University - Durham, US) [dblp]
Classification
- Data Structures and Algorithms
- Human-Computer Interaction
- Social and Information Networks
Keywords
- Science of science
- Multi-level graph algorithms
- network visualization