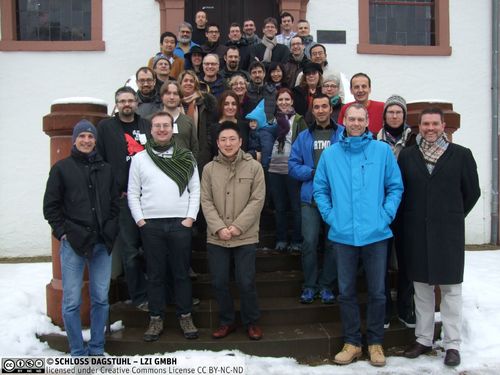
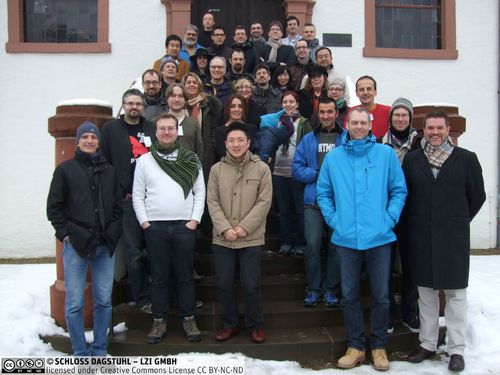
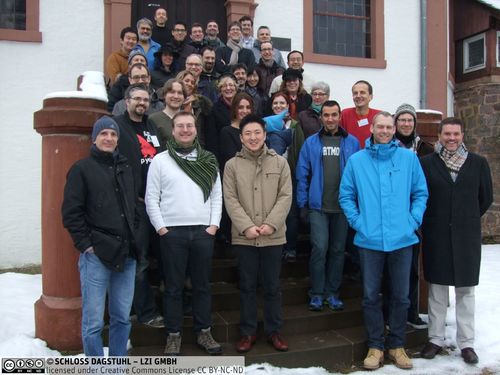
Dagstuhl Seminar 15052
Empirical Evaluation for Graph Drawing
( Jan 25 – Jan 30, 2015 )
(Click in the middle of the image to enlarge)
Permalink
Please use the following short url to reference this page:
https://www.dagstuhl.de/15052
Organizers
- Ulrik Brandes (Universität Konstanz, DE)
- Irene Finocchi (Sapienza University of Rome, IT)
- Martin Nöllenburg (KIT - Karlsruher Institut für Technologie, DE)
- Aaron Quigley (University of St. Andrews, GB)
Contact
- Andreas Dolzmann (for scientific matters)
- Annette Beyer (for administrative matters)
Schedule
Any application where users visually analyze and interact with relational datasets hinges upon graph drawing techniques. Graph drawing, among other things, provides the algorithmic foundations for network information visualization and is crucial in several different domains ranging from social and natural sciences to information systems and engineering.
Algorithmic experiments and user evaluations are indispensable when it comes to developing practically relevant algorithms that produce easy-to-read graph layouts. Implementation and experimentation have been considered as integral aspects of graph drawing from its very inception, even before many other specializations in algorithmics did. Still, in comparison to other disciplines with a long established tradition of high experimental standards, experimental graph drawing research in general does not yet reach the same level of sophistication.
In this slightly off-beat Dagstuhl Seminar, which could be better described as a hands-on workshop, we want to bring together graph drawing researchers with a clear interest in experimental work with experimentation experts from closely related fields in computer science and also from external fields with more established traditions of designing and analyzing scientific experiments, the latter assuming the roles of trainers. By creating an active learning experience we want to initiate the diffusion and acceptance of advanced approaches to experimentation in graph drawing. We aim at establishing principles and experimental methodology by means of guided knowledge import and appropriate adaptation to the graph drawing context. Ideally, this would result in a position paper drafted by seminar participants.
Another goal is to actually design a set of empirical studies for answering research questions in graph drawing. Within mixed break-out groups consisting of experimentation experts as advisors and graph-drawing researchers as domain experts, the newly acquired knowledge will directly be applied to concrete problems. These will be solicited from the participants beforehand, curated, and then reviewed on site. Following the seminar, groups are encouraged to run the conceived experiments, evaluate them, and publish the results.
According to these goals, the seminar week will start with a series of tutorial lectures given by experts in experiment design followed by the formation of working groups, in which actual graph drawing experiments for selected open research questions are designed under the supervision of the experimentation experts. Towards the end of the week the study designs will be presented and evaluated in a feedback round.
Graph Drawing provides, among other things, the algorithmic foundations for network information visualization. It has considered implementation and experimentation as integral aspects from its very inception and recent research has demonstrated varying approaches to empirical evaluation. Experimental standards, however, have never been established, and little progress toward higher levels of sophistication can be observed.
The seminar was a community effort organized as a hands-on training event. It brought together experts on experimentation from fields with an established experimental tradition (referred to as "trainers"), and a group of graph drawing researchers expected to act as exponents and multipliers ("participants"). After two days of invited lectures on experimental methodology in different disciplines and a problem selection session, participants spent three days in working groups designing experiments. Trainers moving between groups and intermittent reporting session facilitated knowledge dissemination.
Participant feedback in the Dagstuhl survey indicates that the inclusion of trainers was highly appreciated. A number of experimental designs for a broad range of problems have been developed, and it is expected that many of them will be implemented and carried out in collaborative follow-up work.
As everyone who has ever been to Schloss Dagstuhl knows, Dagstuhl seminars are the ideal forum for achieving such goals. The fact that a considerable part of the graph drawing community came together for a week to focus on experimentation is expected to lead to a rapid diffusion of the seminar results and foster the acceptance of new methodology and criteria within the community.
On behalf of all participants, the organizer express their sincere gratitude to the Dagstuhl staff for their outstanding service and support.
 Creative Commons BY 3.0 Unported license
 Ulrik Brandes, Irene Finocchi, Martin Nöllenburg, and Aaron Quigley
- Daniel Archambault (Swansea University, GB) [dblp]
- Ulrik Brandes (Universität Konstanz, DE) [dblp]
- Markus Chimani (Universität Osnabrück, DE) [dblp]
- Emilio Di Giacomo (University of Perugia, IT) [dblp]
- Walter Didimo (University of Perugia, IT) [dblp]
- Tim Dwyer (Monash University - Caulfield, AU) [dblp]
- Martin Fink (University of California - Santa Barbara, US) [dblp]
- Irene Finocchi (Sapienza University of Rome, IT) [dblp]
- Rudolf Fleischer (German University of Technology - Oman, OM) [dblp]
- Seok-Hee Hong (The University of Sydney, AU) [dblp]
- Andreas Karrenbauer (MPI für Informatik - Saarbrücken, DE) [dblp]
- Michael Kaufmann (Universität Tübingen, DE) [dblp]
- Karsten Klein (Monash University - Caulfield, AU) [dblp]
- Stephen G. Kobourov (University of Arizona - Tucson, US) [dblp]
- Giuseppe Liotta (University of Perugia, IT) [dblp]
- Catherine C. McGeoch ( D-Wave Systems Inc. - Barnaby, CA & Amherst College, US) [dblp]
- Tamara Mchedlidze (KIT - Karlsruher Institut für Technologie, DE) [dblp]
- Wouter Meulemans (Universität Münster, DE) [dblp]
- Tamara Munzner (University of British Columbia - Vancouver, CA) [dblp]
- Lev Nachmanson (Microsoft Corporation - Redmond, US) [dblp]
- Martin Nöllenburg (KIT - Karlsruher Institut für Technologie, DE) [dblp]
- Yoshio Okamoto (The University of Electro-Communications - Tokyo, JP) [dblp]
- Maurizio Patrignani (Roma Tre University, IT) [dblp]
- Huamin Qu (HKUST - Kowloon, HK) [dblp]
- Aaron Quigley (University of St. Andrews, GB) [dblp]
- Bernice E. Rogowitz (Visual Perspective - New York, US) [dblp]
- Ignaz Rutter (KIT - Karlsruher Institut für Technologie, DE) [dblp]
- Falk Schreiber (Monash University - Caulfield, AU) [dblp]
- Janet Siegmund (Universität Passau, DE) [dblp]
- Bettina Speckmann (TU Eindhoven, NL) [dblp]
- Matthias F. Stallmann (North Carolina State University - Raleigh, US) [dblp]
- Michael Stoffel (Universität Konstanz, DE)
- Dorothea Wagner (KIT - Karlsruher Institut für Technologie, DE) [dblp]
- Alexander Wolff (Universität Würzburg, DE) [dblp]
- Kai Xu (Middlesex University - London, GB) [dblp]
Related Seminars
- Dagstuhl Seminar 05191: Graph Drawing (2005-05-08 - 2005-05-13) (Details)
- Dagstuhl Seminar 08191: Graph Drawing with Applications to Bioinformatics and Social Sciences (2008-05-04 - 2008-05-09) (Details)
- Dagstuhl Seminar 11191: Graph Drawing with Algorithm Engineering Methods (2011-05-08 - 2011-05-13) (Details)
Classification
- data structures / algorithms / complexity
- networks
- society / human-computer interaction
Keywords
- graph drawing
- experimental design
- algorithm engineering
- user studies
- empirical evaluation
- information visualization