Dagstuhl Perspectives Workshop 14022
Connecting Performance Analysis and Visualization to Advance Extreme Scale Computing
( Jan 05 – Jan 10, 2014 )
(Click in the middle of the image to enlarge)
Permalink
Please use the following short url to reference this page:
https://www.dagstuhl.de/14022
Organizers
- Peer-Timo Bremer (LLNL - Livermore, US)
- Bernd Mohr (Jülich Supercomputing Centre, DE)
- Valerio Pascucci (University of Utah, US)
- Martin Schulz (LLNL - Livermore, US)
Contact
- Annette Beyer (for administrative matters)
Publications
- Connecting Performance Analysis and Visualization to Advance Extreme Scale Computing (Dagstuhl Perspectives Workshop 14022). Peer-Timo Bremer, Bernd Mohr, Valerio Pascucci, and Martin Schulz. In Dagstuhl Reports, Volume 4, Issue 1, pp. 17-35, Schloss Dagstuhl - Leibniz-Zentrum für Informatik (2014)
- Connecting Performance Analysis and Visualization (Dagstuhl Perspectives Workshop 14022). Peer-Timo Bremer, Bernd Mohr, Valerio Pascucci, Martin Schulz, Todd Gamblin, and Holger Brunst. In Dagstuhl Manifestos, Volume 5, Issue 1, pp. 1-24, Schloss Dagstuhl - Leibniz-Zentrum für Informatik (2015)
Impacts
- Dagstuhl Manifesto : Connecting Performance Analysis and Visualization to Advance Extreme Scale : pp. 144-146 : article - Bremer, Peer-Timo; Mohr, Bernd; Pascucci, Valerio; Schulz, Martin - Berlin : Springer,. 2014 - (Informatik Spektrum : 37. 2014, 2).
- Dagstuhl Manifesto : Connecting Performance Analysis and Visualization to Advance Extreme Scale Computing : pp. 257-259 : article - Bremer, Peer-Timo; Mohr, Bernd; Pascucci, Valerio; Schulz, Martin - Berlin : Springer, 2014 - (Informatik Spektrum : 37. 2014, 3).
- State of the Art of Performance Visualization : article in Eurographics Conference on Visualization (EuroVis) (2014) : 20 S. - Isaacs, Katherine E.; Gimenez, Alfredo; Jusufi, Ilir; Gamblin, Todd; Bhatele, Abhinav; Schulz, Martin; Hamann, Bernd; Bremer, Peer-Timo - Aire-la-Ville : Eurographics Association, 2014. - 20 S. - (Eurographics Conference on Visualization (EuroVis) 2014).
- TorusVisND : unraveling high-dimensional torus networks for network traffic visualizations : article in VPA '14, Proceedings of the First Workshop on Visual Performance Analysis : pp. 9-16 - Cheng, Shenghui; De, Pradipta; Jiang, Shaofeng H.-C.; Mueller, Klaus - New York : ACM, 2015. - pp. 9-16 - (Workshop on Visual Performance Analysis VPA 2014).
Schedule
Over the last decades an incredible amount of resources has been devoted to building ever more powerful supercomputers. However, exploiting the full capabilities of these machines is becoming exponentially more difficult with each new generation of hardware. To help understand and optimize the behavior of massively parallel simulations the performance analysis community has created a wide range of tools and APIs to collect performance data, such as flop counts, network traffic or cache behavior at the largest scale. However, this success has created a new challenge, as the resulting data is far too large and too complex to be analyzed in a straightforward manner. Therefore, new automatic analysis approaches must be developed to allow application developers to intuitively understand the multiple, interdependent effects that their algorithmic choices have on the final performance.
The natural first step towards automatic analysis is to visualize the collected data to provide some insight into general trends. This helps both application developers and performance experts to form new hypotheses on potential causes of and solutions for performance problems. Furthermore, intuitive visualizations are highly effective in conveying the results of any analysis and thus are a valuable tool throughout the entire process. Unfortunately, visualizing performance data has proven challenging as the information is highly abstract, non-spatial, and often categorical. While some early attempts of visualizations in performance tools have been proposed, these are rudimentary at best and have not found widespread adoption.
At the same time the information visualization and visual analytics community is developing techniques to visualize, illustrate, and analyze complex, non-spatial data. This has led to new general design principles of visualization tools, color spaces, and user interfaces as well as a wide array of common techniques to tackle a broad range of applications. Unfortunately, so far the overlap between these communities is limited even though both areas could gain significantly from a closer collaboration.
Performance analysis is quickly reaching a stage where highly advanced analysis and visualization techniques will be mandatory rather than extravagant optional components. At the same time, visualization researchers are continuously looking for new application areas that challenge the expressive power of their techniques. Together these fields have the potential to establish the field of performance visualization at the intersection of performance analysis and classical visualization and thereby to significantly impact the future of high performance computing.
This Dagstuhl Perspectives Workshop will gather leading experts from both performance analysis and information visualization to:
- Introduce experts in each area to the relevant state of the art of the other;
- Provide a forum to form new collaborations; and
- Discuss medium term strategies to bring the joined work to the attention of funding agencies.
We intend to start the Perspectives Workshop with several overview talks in each fields to create a common ground on the type of data available, the biggest open challenges, and potentially relevant existing work. Each of these will be followed by an open discussion aimed at ensuring that sufficient background knowledge is provided to all participants. These will be followed by breakout sessions focused on particular topic areas such as multi-dimensional analysis, graph drawing, or correlation analysis. The last portion of the workshop will focus on concrete steps to bring joined work to the attention of the various funding agencies in both fields. Given the potential impact of performance visualization on high performance computing the goal is to shape a new research area at the intersection of performance analysis and visualization.
Over the last decades an incredible amount of resources has been devoted to building ever more powerful supercomputers. However, exploiting the full capabilities of these machines is becoming exponentially more difficult with each new generation of hardware. In the systems coming online at this moment, application developers must deal with millions of cores, complex memory hierarchies, heterogeneous system architectures, high-dimensional network topologies as well as a host of other hardware details that may effect the performance of a code. To help understand and optimize the behavior of massively parallel simulations a new subfield of computer science has grown devoted to developing tools and techniques to collect and analyze performance relevant data, such as execution time, operation counts, and memory or network traffic to help application developers pinpoint and ultimately fix performance problems. There now exist a number of standardized tools and APIs to collect a wide range of performance data at the largest scale. However, this success has created a new challenge, as the resulting data is far too large and too complex to be analyzed in a straightforward manner. While there exist some tools for performance analysis and visualization, these are predominately restricted to simple plots of the raw data and rely virtually exclusively on the users to infer connections between measurements and the observed behavior and to draw conclusions. Unfortunately, as the number of cores increases, this approach does not scale. The raw data is typically rather abstract, low-level, and unintuitive and it is difficult to understand within the context of the highly complex interaction of an application with the middle- and system software and the underlying hardware. For this reason, new automatic and more scalable analysis approaches must be developed to allow application developers to intuitively understand the multiple, interdependent effects that their algorithmic choices have on the resulting performance.
Following classical visualization mantra, the natural first step towards automatic analysis is to display an overview of the collected data to provide some insight into general trends. This helps both application developers and performance experts to form new hypotheses on potential causes of and solutions to performance problems. Furthermore, intuitive visualizations are highly effective in conveying the results of any analysis and thus are a valuable tool throughout the entire process. Unfortunately, visualizing performance data has proven challenging as the information is highly abstract, non-spatial, and often categorical. While some early attempts at including more advanced visualizations in performance tools have been proposed, these are rudimentary at best and have not found widespread adoption.
At the same time there exists a vibrant community in the area of information visualization and lately visual analytics that is exclusively aimed at developing techniques to visualize, illustrate, and analyze complex, non-spatial data. In particular, there exists a large body of work on general design principles of visualization tools, color spaces, and user interfaces as well as a wide array of common techniques that tackle a broad range of applications. The Dagstuhl Perspectives Workshop, for the first time, gathered leading experts from both the fields of visualization and performance analysis for joint discussions on existing solutions, open problems, and the potential opportunities for future collaborations.
The week started with a number of keynote sessions from well-known authorities in each area to introduce the necessary background and form a common baseline for later discussions. It soon became apparent that there exists a significant overlap in the common tasks and challenges in performance analysis and the abstract problem definitions and concepts common in visualization research. Subsequently, the workshop continued with short talks focusing on various more specific aspects of either existing challenges or potential solutions interspersed with increasingly longer group discussions. Theses extensive, inclusive, and in-depth exchanges ultimately shaped the second half of the workshop and in this form were only made possible through Dagstuhl's unique collaborative and discussion stimulating environment.
Ultimately, the workshop has started a number of collaborations and research projects between previously disparate fields with the potential of significant impact in both areas. Furthermore, the participants distilled the open challenges into three high-level recommendations: First, joined funding for the various open research questions. Second, support to build and foster a new community on the border of visualization and performance analysis. And Third, the need to better integrate the anticipated results into the entire lifecycle of a massively parallel application from design to optimization and production.
 Creative Commons BY 3.0 Unported license
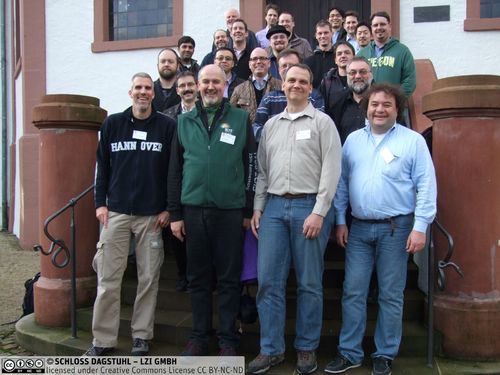
 Peer-Timo Bremer, Bernd Mohr, Valerio Pascucci, and Martin Schulz
- Abhinav Bhatele (LLNL - Livermore, US) [dblp]
- Peer-Timo Bremer (LLNL - Livermore, US) [dblp]
- Holger Brunst (TU Dresden, DE) [dblp]
- Hans-Joachim Bungartz (TU München, DE) [dblp]
- Remco Chang (Tufts University - Medford, US) [dblp]
- Hank Childs (University of Oregon - Eugene, US) [dblp]
- Todd Gamblin (LLNL - Livermore, US) [dblp]
- Markus Geimer (Jülich Supercomputing Centre, DE) [dblp]
- Judit Gimenez (Barcelona Supercomputing Center, ES) [dblp]
- Hans Hagen (TU Kaiserslautern, DE) [dblp]
- Daniel A. Keim (Universität Konstanz, DE) [dblp]
- Joshua A. Levine (Clemson University, US) [dblp]
- Naoya Maruyama (RIKEN - Kobe, JP) [dblp]
- Bernd Mohr (Jülich Supercomputing Centre, DE) [dblp]
- Christopher Muelder (University of California - Davis, US) [dblp]
- Klaus Mueller (Stony Brook University, US) [dblp]
- Matthias S. Müller (RWTH Aachen, DE) [dblp]
- Wolfgang E. Nagel (TU Dresden, DE) [dblp]
- Valerio Pascucci (University of Utah, US) [dblp]
- Ulrich Rüde (Universität Erlangen-Nürnberg, DE) [dblp]
- Carlos E. Scheidegger (AT&T Labs Research - New York, US) [dblp]
- Tobias Schreck (Universität Konstanz, DE) [dblp]
- Martin Schulz (LLNL - Livermore, US) [dblp]
- Derek Xiaoyu Wang (University of North Carolina - Charlotte, US) [dblp]
- Felix Wolf (GRS for Simulation Sciences - Aachen, DE) [dblp]
Classification
- computer graphics / computer vision
- hardware
- networks
Keywords
- Large scale data presentation and analysis
- Exascale class machine optimization
- Performance data analysis and root cause detection
- High dimensional data representation